Bitcoin and Ethereum are still in stable consolidation

Bitcoin and Ethereum are still in stable consolidation
Bitcoin chart analysis
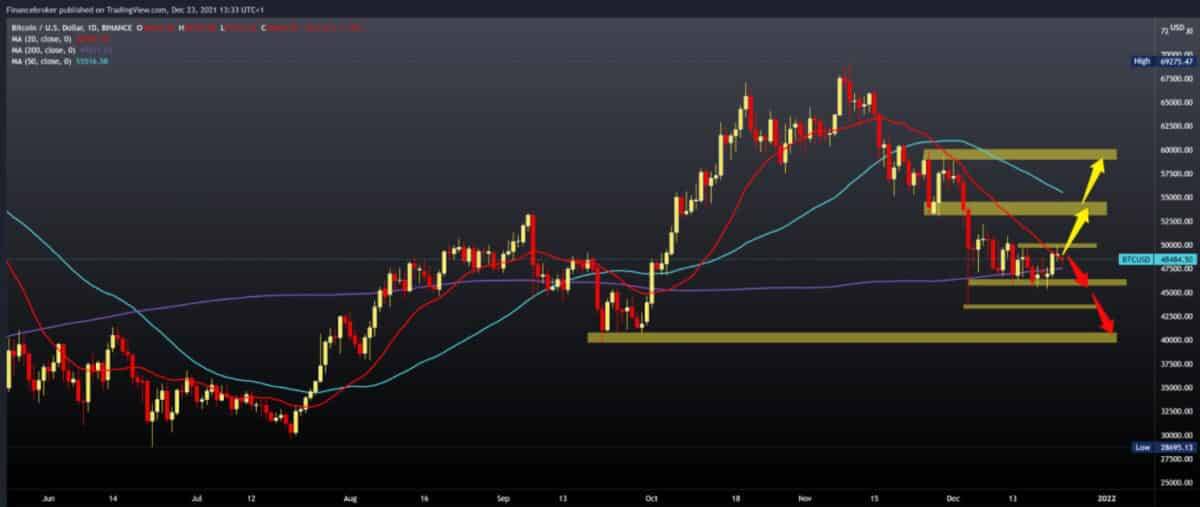
Looking at the Bitcoin chart on the daily time frame, we see that we are still consolidating around the MA200 moving average. In the previous attempt for a bullish trend, the obstacle was the MA20 moving average, and the price failed to break above it. That was about $ 60,000 level. Now the picture is different, and there is a possibility that the MA20 will turn up and support the price of Bitcoin. With the MA200 and MA20, the price would have great support on the chart up to $ 55,000, where we will encounter the MA50 moving average.
Bullish scenario:
• We need to continue this positive consolidation and break the $ 50,000 level with support in moving averages from below.
• Our next potential resistance is at $ 52,500, then we come to the $ 55,000 level and MA50 moving average.
• Just a break above this zone can give us the wind in our backs to jump to a $ 60,000 level.
Bearish scenario:
• We need a negative consolidation and a price hike to test the previous support zone to $ 46,000.
• Then we go below the MA200 daily moving average, which can increase the bearish pressure on the price.
• Our first support is at $ 45,000, and if it doesn’t last, we go lower to the December low of $ 43,600.
• The lower big support zone awaits us at $ 40,000 from September.

Ethereum chart analysis
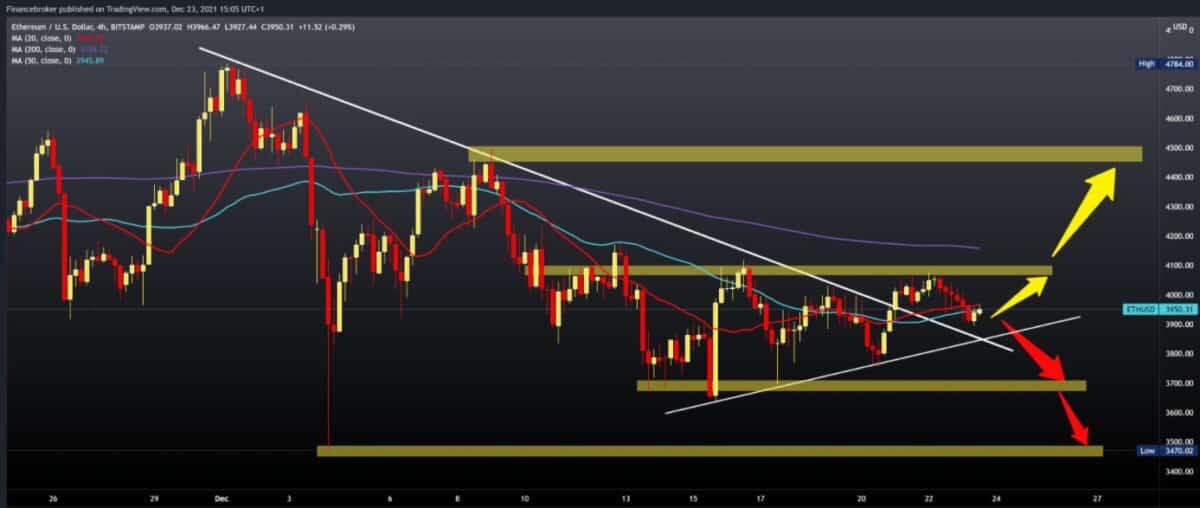
Yesterday, Ethereum stood at $ 4050 and made a new turn towards lower support. The price stopped at $ 3900 and again made a slight positive shift to the current $ 3955. It is now consolidating around MA20 and MA50 moving averages, and we need a break above as we have confirmed the new bullish momentum. We look at the MA200 at 4150 as the next higher resistance on the chart.
Bullish scenario:
• We need to continue this positive consolidation and a new jump to the previous resistance zone at $ 4,100.
• The price break above brings us to the MA200 in hopes of getting through and over that hurdle.
• We have a larger resistance zone at $ 4,500, and if the price breaks above, then we can say that we are back in the bullish trend.
Bearish scenario:
• We need a further price hike to the bottom trend line at $ 3900.
• The break below drops us to the previous higher low at $ 3800.
• We are looking for the next potential support at $ 3650, then at $ 3470 December minimum.

Market overview
A new study called “Blockchain Analysis of the Bitcoin Market” found that illegal transactions, fraud, and gambling together account for only 3% of the total on-chain volume of the bitcoin trade. On the other hand, the study claims that the volume related to exchange and trade – which is mostly speculative – accounts for about 80% of the total volume.
Unlike the method used in the 2019 study, Makarov and Schoar include exchange offices, counter (OTC) tables, or trading table data when calculating false amounts of BTC. Accordingly, in their analysis, the two authors conclude that the volume related to exchange and trade accounts for about 80% of the total volume. At the same time, other known entities are responsible for only a small part of the total volume by the end of 2020.
Although Makarov and Schoar suggested in their report that they agreed with the general concern about the pseudonymous nature of bitcoin transactions, they insisted that “it is important to correctly determine the size of transaction activities to understand the ultimate drivers of bitcoin value.”
The post Bitcoin and Ethereum are still in stable consolidation appeared first on FinanceBrokerage.
0 Response to "Bitcoin and Ethereum are still in stable consolidation"
Post a Comment