Bitcoin, Ethereum, Dogecoin under increased pressure

Bitcoin, Ethereum, Dogecoin under increased pressure
The price of Bitcoin is increasingly leaning towards the bearish side. Currently, the price is calm at 48,000, trying to form support on the chart with the support of MA200 moving averages. This week was marked by consolidation in the $ 48000-52000 zone. We need a breakdown or up for a stronger momentum on the chart to recognize the potential trend.
Bullish scenario:
- We need positive consolidation, and with the support of the MA200 moving average, we expect to move up.
- If the price continues to rise, our next first resistance is at $ 52,000, and we need a break above to return to the bullish trend.
- Next, we came across a supportive trend line until the price made a break below, and the potential jump above climbs us to $ 55,000, where we get support in the MA20 moving average.
Bearish scenario:
- We need continued negative consolidation and a break below $ 48,000 and the MA200 running average.
- In the further fall of the price, we encounter potential support at $ 44,000, and if it does not last either, we will descend to a larger support zone at $ 4,000 from the end of September.

Ethereum chart analysis
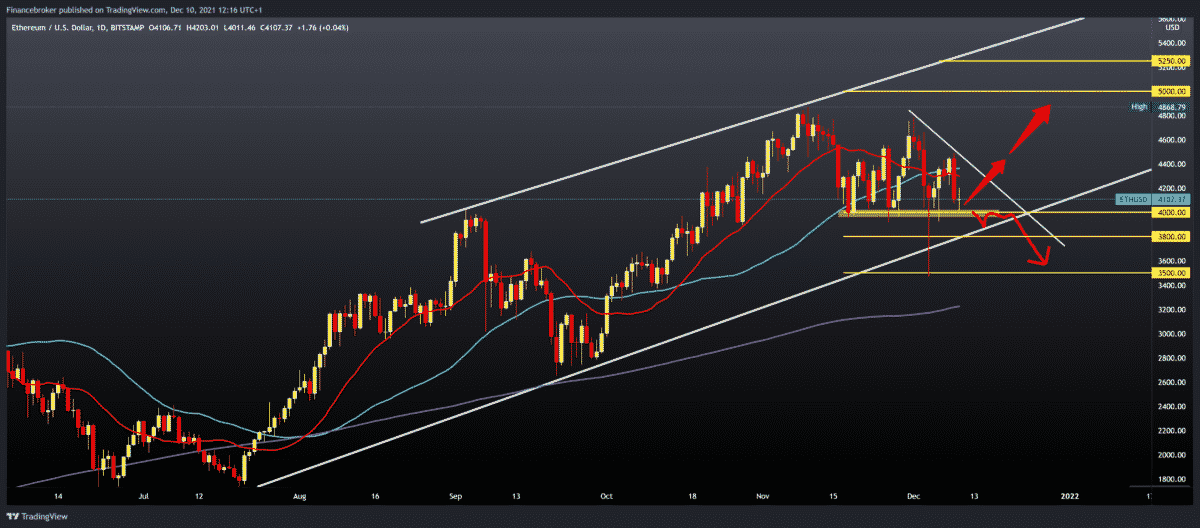
Looking at the daily time frame chart, we see that the Ethereum price fell sharply by $ 4,500 to $ 4,100 yesterday. Now we are looking to see if the price will find new support at $ 4000 and continue up again, or we will see a break below and the formation of new lows.
Bullish scenario:
- We need a new positive consolidation that will separate the price from the $ 4,000 support zone.
- In the zone around $ 4400, we encounter potential resistances in the MA20 and MA50 moving averages, which may be an obstacle to further on the bullish side.
- Also, the price should form a new higher high on the chart and go above $ 4,500.
- Our next target is last week’s high at $ 4800, followed by the historical high at $ 4868.
Bearish scenario:
- We need to continue this negative consolidation and drop the price below $ 4000.
- We are looking for lower support on the lower trend line in the zone 3800-3900 $.
- The break below the trend line opens the door for us to confirm the December lower low at $ 3475.

Dogecoin chart analysis
The dogecoin price this week consolidated in the range of 0.16000-0.18000. The pressure on the lower support zone increases, and it is possible to see a break below 0.16000. A fall in prices is more likely than recovery and a transition to a bullish trend.
Bullish scenario:
- We need new positive consolidation and new testing of the 0.18000 zone, and a potential break could move us to 0.20000 of the previous support zone.
- We also have a trend line on the upper side that directed the price towards lower values in the previous period.
- In the following, our next target is 0.22000 with additional resistance in the MA50 moving average, while the daily MA200 in the zone is around 0.25000.
Bearish scenario:
- We need to continue the negative consolidation and break with stronger pressure of the lower support zone at 0.16000.
- A further drop in prices leads us to the previous lower low in the 0.14000 zone.
- For now, the bearish image is more present on the chart, so a drop to 0.10000 is very possible.

The post Bitcoin, Ethereum, Dogecoin under increased pressure appeared first on FinanceBrokerage.
0 Response to "Bitcoin, Ethereum, Dogecoin under increased pressure"
Post a Comment