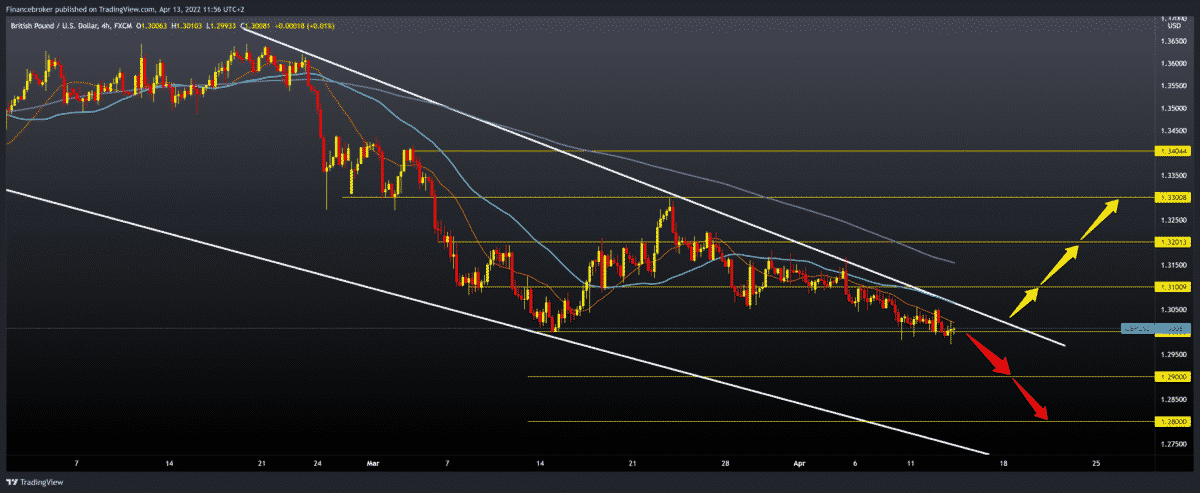
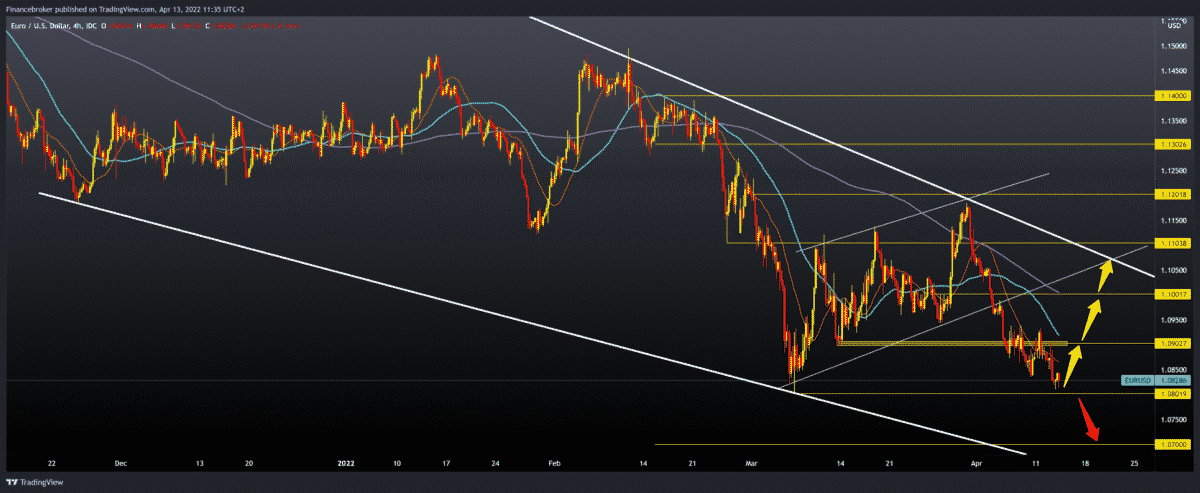
13 April chart overview for EURUSD and GBPUSD

13 April chart overview for EURUSD and GBPUSD
- During the Asian session, the euro continues to slide down against the dollar.
- During the Asian session, the British pound weakened against the dollar.
- The O.N.S. (The Office for National Statistics) said this morning that the UK’s consumer price inflation rose more than expected and reached a record high in March.
EURUSD chart analysis
During the Asian session, the euro continues to slide down against the dollar. It was announced yesterday that the USA’s consumer price index (inflation) rose by 8.5% in March. On a year-on-year basis, it was expected to be + 8.4%, which confirms the thesis about the “hawkish” monetary policy of the Fed in the coming period. The EU is further deteriorating its relations with Russia, economically, politically and diplomatically, the meeting of ministers of EU member states showed yesterday. The euro is exchanged for 1.08280 dollars, which is a minimal strengthening of the common European currency by 0.02% since the beginning of trading tonight. A regular meeting of the ECB is being held tomorrow, which may increase market volatility. For the bearish option, we need a break below 1.08000. After that, we are looking for the next support at 1.07000, and additional support is our lower trend line. For the bullish option, we need a new positive consolidation and a EURUSD jump above 1.09000. After that, we get additional support in MA20 and MA50 moving averages. Our next target is the 1,10000 level, where we come across the MA200 moving average, which can be a bigger obstacle for us on the chart. We are also at that level very close to the upper trend line, which can put extra pressure on EURUSD and send it back to lower levels.
GBPUSD chart analysis
During the Asian session, the British pound weakened against the dollar. Data from the United Kingdom showed yesterday that the British economy grew by only 0.1% in February, which missed the market expectation of 0.3%. The economic slowdown with the British embargo on Russian coal and oil imports is putting a lot of pressure on the pound. The US dollar index has exceeded its psychological level of 100.00 and is now in a big rush against all major currencies. The pound is trading at 1.29980 dollars, which is weakening the British currency by 0.01% since the beginning of trading tonight. For the bearish option, we need a stronger break below 1.30000, at least up to 1.29500. After that, space opens up for us until the next potential support at 1.29000. The last time we were here was in November 2020. For the bullish option, we need a new positive consolidation and a jump of GBPUSD above 1.30500. after that, we got support in MA20 and MA50 moving averages, and we also made a break above the previous falling trend line. Our next target is 1.31000, while in the zone around 1.31500, we have a moving MA200 moving average. If the pound continues to strengthen, our potential targets are 1.32000, then 1.33000 March high.

Market overview
U.K. Consumer Price Index (CPI)
The O.N.S. (The Office for National Statistics) said this morning that the UK’s consumer price inflation rose more than expected and reached a record high in March.
Consumer price inflation rose to 7.0 % from 6.2 % in February. The rate is forecast to rise to 6.7 %.
This was the highest annual inflation in the National Statistics Series, which began in January 1997. It was also the highest rate in a series since March 1992, when it was 7.1 %.
Core inflation, which excludes energy, food, alcohol and tobacco, rose to 5.7 % in March from 5.2 % in February. This was also slightly above the economists’ forecast of 5.4 %.
At the same time, input price inflation rose to 19.2 % from 15.1 % in February. The ONS announced that this is the highest percentage point of the increase in the annual rate and the highest annual rate since the beginning of the records in January 1997.
The inflow rate was 5.2 % in March, compared to 1.8 % in February. This was the highest monthly rate since the beginning of the records in February 1996.
The post 13 April chart overview for EURUSD and GBPUSD appeared first on FinanceBrokerage.

0 Response to "13 April chart overview for EURUSD and GBPUSD"
Post a Comment