09 May chart overview for Oil and Natural gas

OIl chart overview
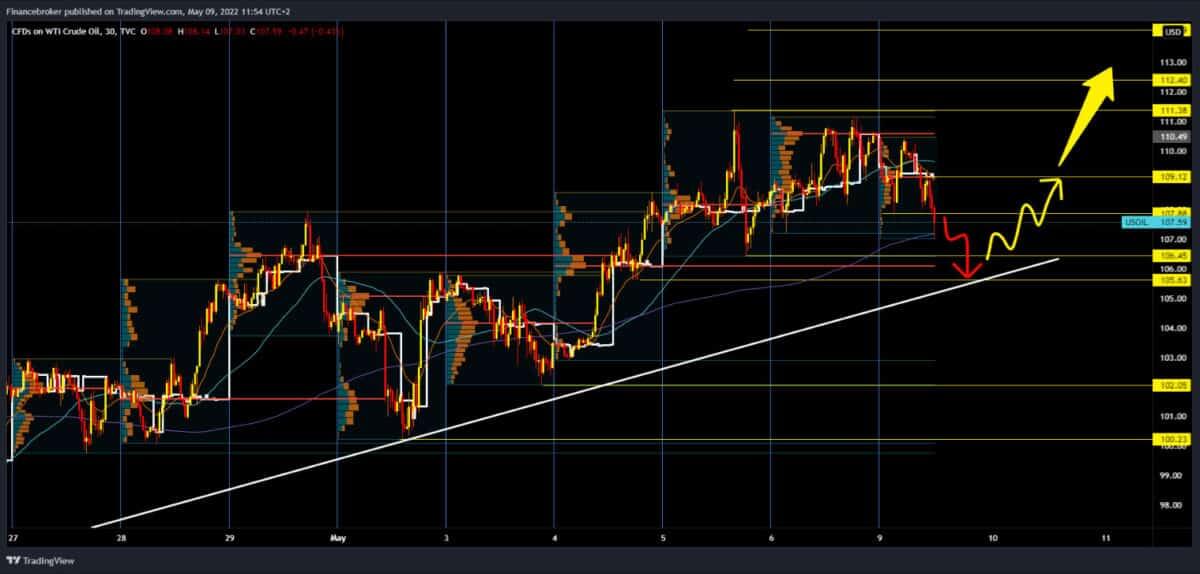
During the Asian session, the oil price was unstable, ranging from 107.88 to 110.50 dollars. as the European session began, bearish price pressures intensified, leading to a new price drop to the $ 107.00 level. On Friday, the price only confirmed the previous high at $ 111.00, and we did not see the formation of a new higher high on the chart. On the contrary, the price formed a new lower high, which is a sign of a reversal of the trend. The target for the new lower low is the zone around the lower trend line where we can expect potential support, and the price range is 105.60-106.45 dollars. For the bullish option, we need a return to the zone of around $ 111.00. Price could then put pressure on the resistance zone and make a break above and continue his bullish recovery. Our next bullish target is $ 111.40, $ 112.40, then $ 114.00 high from March 25th.

Natural gas chart overview
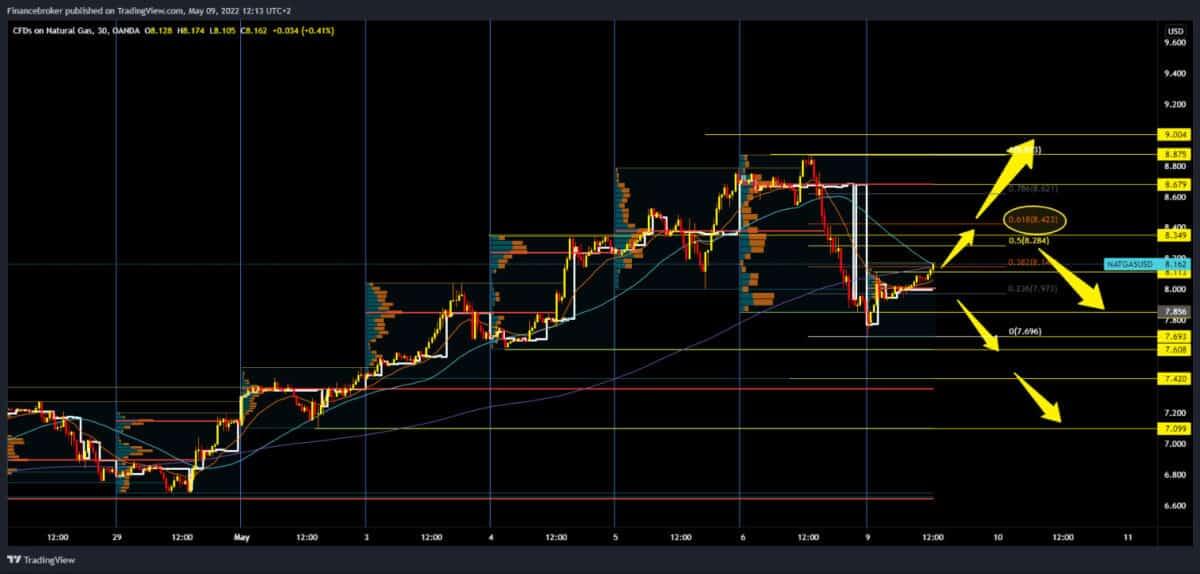
The price of natural gas formed its maximum at $ 8.87 on Friday but withdrew very soon after that. The price dropped to $ 7.69 at the beginning of the opening of the Asian session. Since then, we have been in bullish consolidation, and we are now at the $ 8.12 level. If this trend continues, we can expect the price to rise to $ 8.35. A very important zone is at the $ 8.68 level, and if a break occurs above, then the price could jeopardise the $ 9.00 level. To continue on the bearish side, we need to form the first new lower high on the chart in the zone around $ 8.40. With the Fibonacci setting on the chart, the place of resistance is at 61.8% Fibonacci level. Such a scenario would force the price to drop to $ 7.60 and maybe to the $ 7.00 level.
Market overview
The International Monetary Fund released a report Sunday on the impact of rising oil prices on global inflation and prospects for further growth. The key statement is: “For some, the current rising oil prices can be compared to the 1970s, when geopolitical tensions also caused a jump in fossil fuel prices.”
“Central banks have also changed since the 1970s. Today, there are more independents, and the credibility of monetary policy has greatly strengthened over previous decades.”
“Expectations are that global growth will be close to the average before the pandemic of 3.5%. Even after the April events in the world were affected, the forecasts for the world economy were lowered, and inflation could be higher than expected.
“The negative impact could be most pronounced in Europe, given their relatively big reliance on Russian energy imports.
The post 09 May chart overview for Oil and Natural gas appeared first on FinanceBrokerage.

0 Response to "09 May chart overview for Oil and Natural gas"
Post a Comment