The Heikin Ashi Strategy – The Technical Traders Technique

The Heikin Ashi Strategy – The Technical Traders Technique
Have you ever thought about the heikin ashi technique while trading on the market? Are you among technical traders eager to identify a given trend with more ease and increase their profits in the long run?
Do you want to learn a new, fresh technique that will help you in increasing the chances of great earnings and advancement in the career of a trader?
If you are 100% sure that you want to learn valuable techniques and strategies that will turn you into a top-notch trader, then it is time to learn all the famous secrets about Heikin Ashi’s strategy from experienced traders! Let’s start with the basics of Heikin Ashi’s strategy, shall we?
What is the Heikin Ashi strategy exactly?
Whether you’re an experienced trader or getting into this ever-evolving, profitable industry, you need to know that the Heikin Ashi strategy represents a Japanese candlestick-based technical trading tool. It uses candlestick charts to show and visualize market price data.
The Heikin-Ashi technique is helpful because it forecasts price movements and identifies market trend signals. To filter out disturbing market noise, it uses average price data. Filtering out the noise is helpful since it clearly illustrates marketing trends and directions that enable potential price movements.
So, in simple words, the well-known Heikin Ashi strategy averages price data to develop a Japanese candlestick chart that filters out market noise.
A brief history

When it comes to a brief history of Heikin Ashi charts, it is good to know that Muneshia Homma developed them in the 1700s. They share specific characteristics with the standard candlestick charts that we know today. However, they differ based on the values that are used in order to create every single candle.
So, instead of using the high, low, open, and close as standard candlestick charts do, the Heikin Ashi strategy uses a modified formula entrenched on two-period averages. Thanks to that, it looks smoother, and it’s much easier for traders to spot reversals and trends.
Nonetheless, keep in mind that, in most cases, it also may obscure gaps and some of the usual price data.
Who is using the Heikin Ashi strategy the most?
This famous strategy is primarily used by technical traders keen to identify a specific trend more easily. These traders can adjust all their positions properly, meaning either locking in a profit on the chosen position or avoiding losses.
The reason why many technical traders choose this trading technique is because it assists traders in identifying the right time for:
- Holding on to a trade
- Pausing a trade
- Identifying if a reversal is likely to occur
What is the formula of the Heikin Ashi technique?
As a technical trader who is eager to increase their chances of making a profit while trading, it’s crucial to know and understand the formula of the Heikin Ashi technique. The famous Heikin Ashi candles are calculated in the following way:
- Open: (Open (previous candle) + Close (previous candle))/2. Close: (Open + Low + Close + High)/4. High: the same as the actual candle.
So, in this case, high represents the maximum value from the open, close, or high of the current period. The low is the minimum value from the current period’s open, close, or low. Keep in mind the following:
The Heikin Ashi data is able to be of different time frames, meaning weekly, monthly, or intraday. The HA open is, without exception, set to the midpoint of the body of the past bar, and the HA close is calculated from the average price of the current bar.
The HA high equals the highest value among the HA open, HA close, and the current high. To understand this, it is essential to consider the following:
- HA – Heikin-Ashi
- -1 – Prior period figures
- 0 – Current period figures
Steps for calculating the Heikin Ashi
Let’s go a little further and know the essential steps for its calculation.
- To create the First Heikin Ashi candle, use one period using the formulas. You can use open, close, high, and low in order to create the first HA close price. In order to create the first HA open, use the open and close. Keep in mind that the high of the period is likely to be the first HA high, while the low will equal the first HA low.
- Once the first HA gets calculated by technical traders, it’s advisable to continue computing the HA candles per the formulas.
- Utilize the open, high, low, and close from that period to calculate the next close.
- If you aspire to calculate the next open, it’s crucial to use the prior open and close.
- In order to calculate the next high, it is necessary to pick the maximum of the current period’s high or the current period’s HA open or close.
- We advise you to choose the maximum of the current period’s low or the current period’s HA close or open for calculating the next low.
Remember that the HA open and close are not the same as the period’s open and close for the last two steps here. It means that the HA open and close were calculated in the previous third and fourth steps.
What can you tell from the Heikin Ashi strategy?
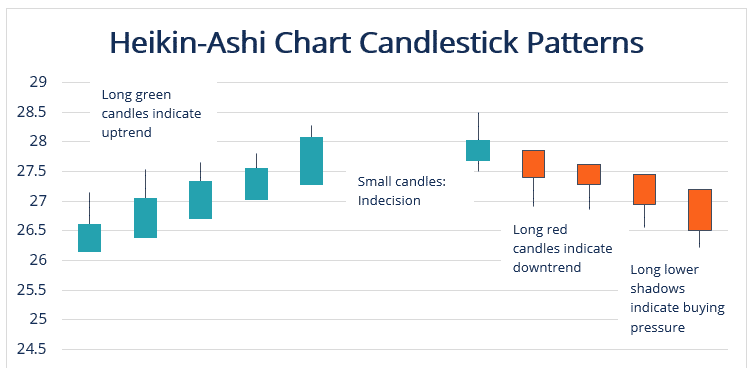
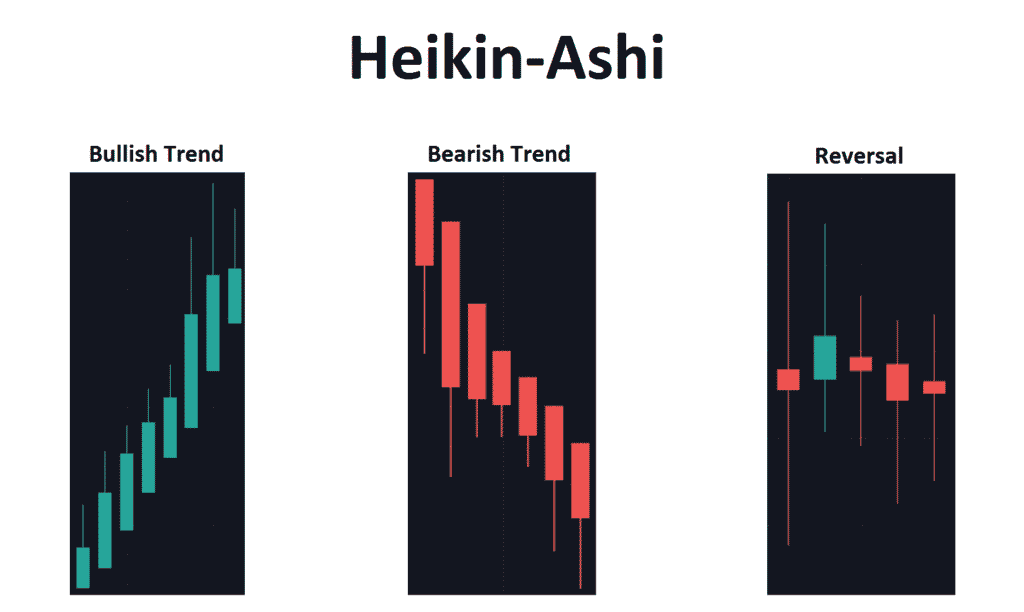
If you’ve been wondering what this strategy is known for and what it can tell you, then it’s time to learn that Heikin Ashi is useful for identifying the current trend without any potential issues. So, green or hollow white candles that exclude the lower shadows are mainly used to signal a strong uptrend.
On the other hand, the red or filled black candles with no upper shadow are utilized by technical traders for them to identify a solid downtrend.
Reversal candlesticks

When it comes to reversing candlesticks using the Heikin Ashi strategy, you should keep in mind that they are similar to traditional candlestick patterns. It means they have long upper and lower shadows and pretty small bodies.
The current candle is calculated with the help of the previous candle since there are no gaps on the famous Heikin Ashi chart. Taking into account that this technique smooths price information over two periods makes price patterns, trends, and reversal points much easier to spot.
Very frequently, these candles on a traditional candlestick change from up to down. It all makes it very difficult for candles to be interpreted. For that reason, heikin Ashi charts usually include more consecutive coloured candles that help traders identify past price movements without any issues.
What exactly does heikin ashi reduce precisely?
The Heikin Ashi strategy successfully reduces false trading signals in choppy markets and sideways. It helps technical traders to avoid placing trades at these particular times.
So, for example, a trader will likely receive a valid signal instead of two false reversal candles before one trend starts. Of course, if he’s using the Heikin Ashi strategy in the first place.
Get to know all the famous heikin ashi strategies.

Now that you are familiar with all the basics of heikin ashi, it is time to learn the core basics of all the famous heikin ashi strategies:
- Heikin Ashi binary options strategy -. This particular strategy is very dependent on important economic news, so use the economic calendar.
- Ichimoku Heikin Ashi strategy – It’s best to combine Ichimoku and Heikin Ashi since they work in any market and any time frame. Combining them, a trader and even an investor have a high chance of long-term success.
- Heikin Ashi binary options strategy – One of the best trend indicators. Delay isnćt a significant drawback since opening with 1-2 candles enables you to enter a strong signal and close precisely at the end of the trend.
- Heikin Ashi intraday strategy – The Heikin Ashi strategy is beneficial to short term traders. Whether swing trading or day trading. It is possible to use it in any market, including forex, stocks, commodities and indices.
- Smoothed Heikin Ashi strategy – Keep in mind that, when it comes to Heikin Ashi smoothed strategy, the markets are in an uptrend, usually once the smoothed Heikin Ashi indicator equals green or bullish. On the other hand, the markets are downtrend once the smoothed Heikin Ashi indicator is red or bearish.
- Heikin Ashi scalping strategy – This particular strategy is for short-term traders who quickly get in and out of trades. Usually, it happens multiple times every day.
Summary
In conclusion, we will single out the most shadowy things from this text that you need to remember to implement the famous Heikin Ashi strategy successfully. Here’s what matters:
- Heikin Ashi represents a candlestick pattern strategy or technique with the primary goal of reducing some of the monotonous market noise. In addition to that, it aims to create a chart that highlights the trend direction in a much better way than usual candlestick charts.
- What happens to be the downside of this strategy is that some price data will get lost with averaging. It could affect risk.
- Candles which are long down with upper shadow represent solid selling pressure, while candles that are extended up with no lower shadows or little signal solid buying pressure.
The post The Heikin Ashi Strategy – The Technical Traders Technique appeared first on FinanceBrokerage.

0 Response to "The Heikin Ashi Strategy – The Technical Traders Technique"
Post a Comment