09 August chart overview for Oil and Natural Gas

09 August chart overview for Oil and Natural Gas
Oil chart analysis
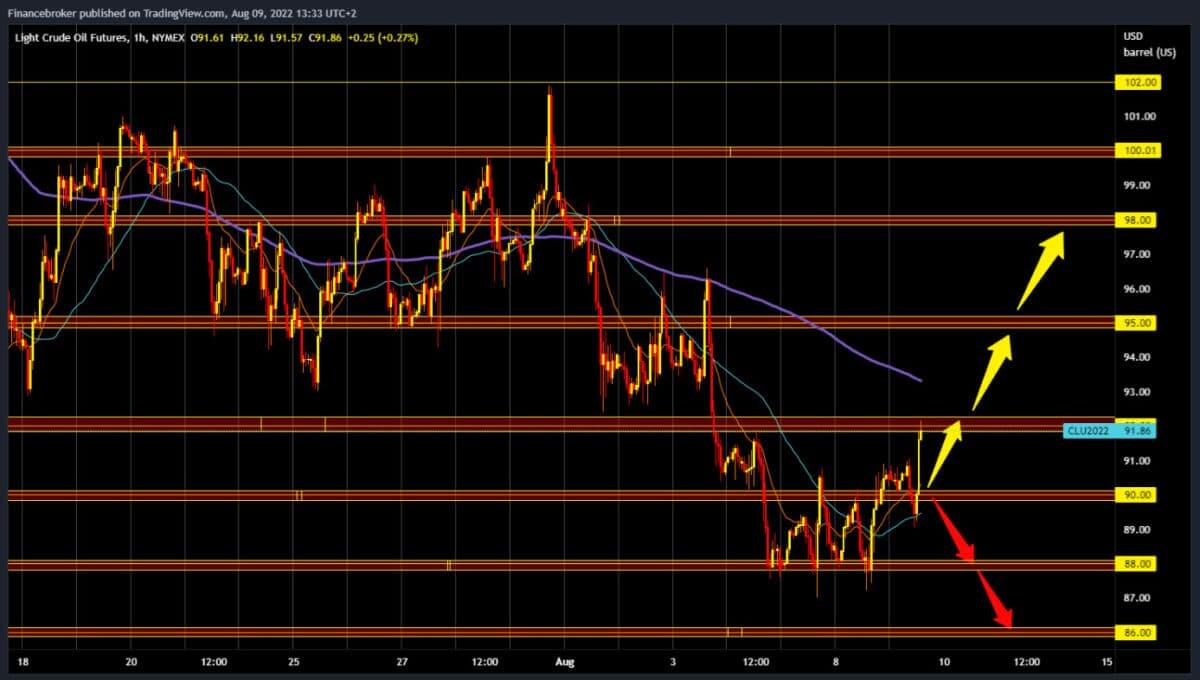
In the previous two days, the price of oil consolidated in the range of $88.00-$90.00. During today’s Asian trading session, the price made a strong move and climbed to the $92.00 level. Today’s low was at the $89.00 level, and a bullish impulse followed from there. We must hold above the $92.00 level to continue the bullish option. Then a new positive consolidation is needed, from which a new bullish impulse would emerge. The first target is the $93.00 level, and the additional resistance at that level is in the MA200 of the moving average. Potential higher targets are $94.00 and $95.00. We need a new negative consolidation and a return to this morning’s support zone at the $90.00 level for a bearish option. A price drop below would re-intensify the bearish pressure, and then we would likely see a continuation of the decline to the $88.00 level. Potential lower targets are $87.00 and $86.00.

Natural gas chart analysis
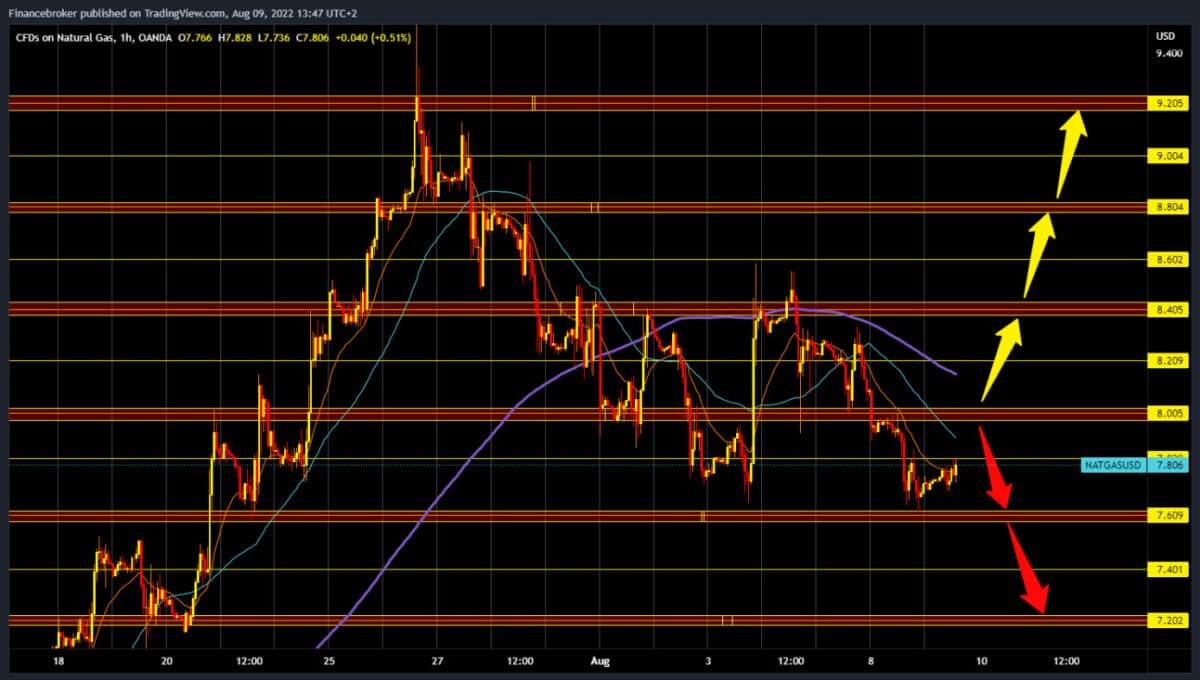
Today, the gas price is stable and ranges between $7.60-7.80. The current consolidation is neutral but with less bearish pressure as the gas price has been falling for the last ten days. For a bearish option, we need a negative consolidation and a drop in the gas price below the $7.60 level. After that, we expect a continuation of the pullback towards the $7.40 and $7.20 levels. For a bullish option, we need positive consolidation and price growth to the $8.00 level. If the gas price manages to hold above that level, it will receive additional support in the MA20 and MA50 moving averages. After that, we expect the price to continue at $8.20, then to the $8.40 level.
 Market overview
Goldman Sachs has revised its forecast for Brent crude to $110 a barrel for the quarter. Goldman Sachs’ previous projection was $140 for Brent crude oil per barrel. That investment bank still believes that higher oil prices are more realistic in the coming period because they expect an increase in the oil deficit. Tonight we are expecting a report from The American Petroleum Institute (API) on the state of oil reserves on American soil.
The post 09 August chart overview for Oil and Natural Gas appeared first on FinanceBrokerage.
0 Response to "09 August chart overview for Oil and Natural Gas"
Post a Comment