10 August chart overview for Oil and Natural Gas

10 August chart overview for Oil and Natural Gas
Oil chart analysis
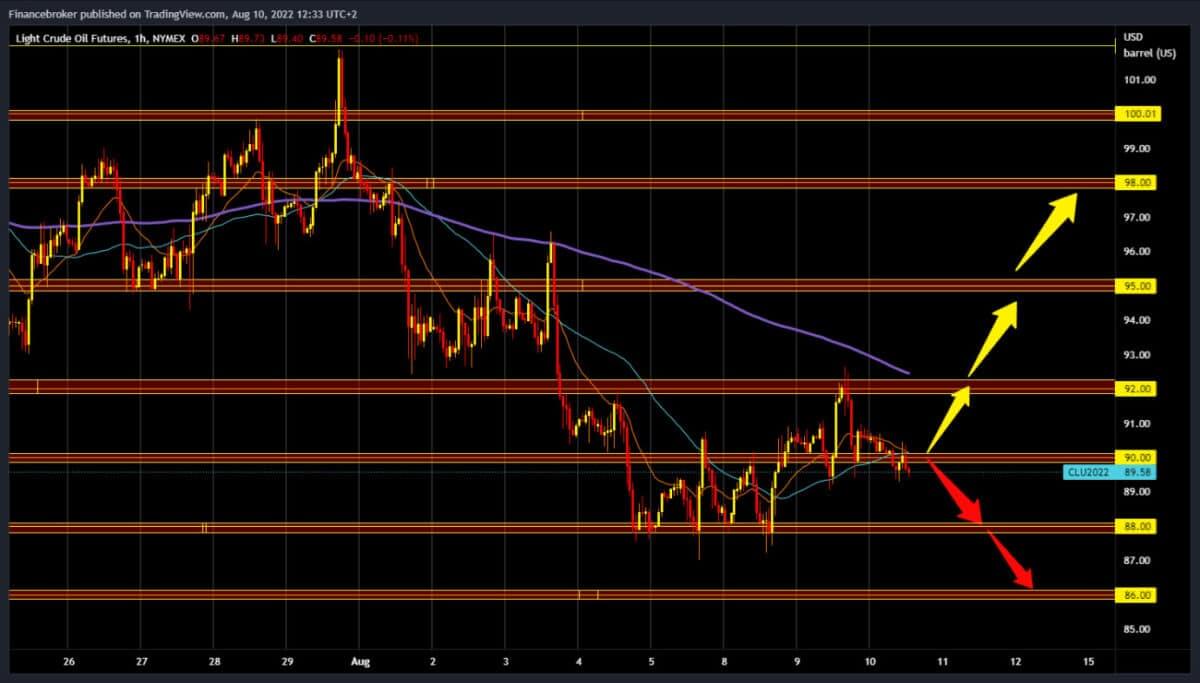
Oil fell on Wednesday after industry data showed U.S. crude inventories rose unexpectedly last week, hinting at a potential drop in demand. During the Asian trading session, oil price again retreated below the $90.00 level. And now we are again looking at the $88.00 support zone. U.S. crude oil inventories rose by about 2.2 million barrels in the week ending Aug. 5, market sources said, citing data from the American Petroleum Institute. On Monday, the European Union released the final text to continue the 2015 Iran nuclear deal that will increase Iranian oil exports. For a bullish option, we need a new positive consolidation and a return above the $90.00 level. After that, we need to stay above that level if we want to continue the recovery. Potential higher targets are $91.00 and $92.00 levels.
 Natural gas chart analysis
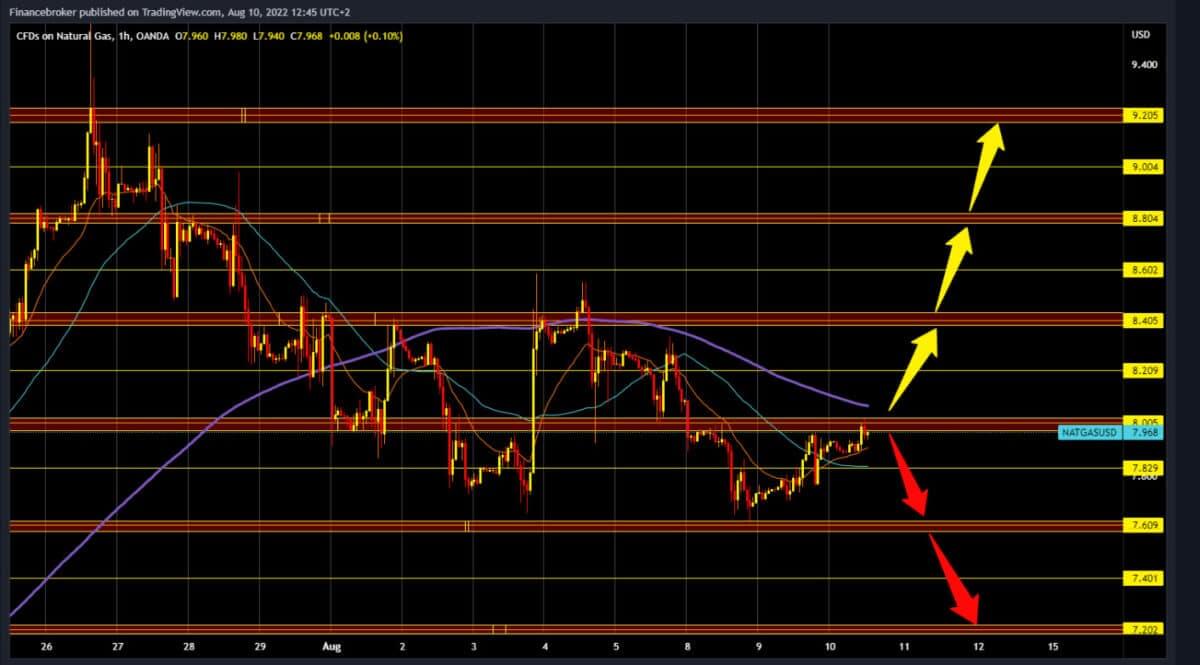
During the Asian trading session, the price of natural gas is on a smaller rise. We managed to climb up to the $8.00 level, but not to hold on to that level, and a short pullback followed. Additional pressure is created for us from the upper side of the MA200 moving average. We need positive consolidation and a return above the $8.00 level to continue the bullish trend. After that, we must hold above and continue towards the $8.20 and $8.40 levels. Our potential resistance is MA200 in the zone around $8.10. For a bearish option, we need a negative consolidation. After that, we can expect the gas price to continue its retreat, and the potential lower targets are $7.80 and $7.60.
 Market overview
Ukraine has halted shipments through the pipeline to parts of central Europe as Western sanctions have prevented Moscow from paying transit taxes. Flows along the pipeline’s southern route were affected, while the northern route serving Poland and Germany was unaffected.
The American Petroleum Institute (API) reported an unexpected increase in crude oil last night of 2.156 million barrels, as analysts predicted a drawdown in oil inventories. The build-up in storage comes as the Ministry of Energy released 5.3 million barrels from strategic reserves.
The post 10 August chart overview for Oil and Natural Gas appeared first on FinanceBrokerage.
0 Response to "10 August chart overview for Oil and Natural Gas"
Post a Comment