Oil and Natural Gas: High Volatility

Oil and Natural Gas: High Volatility
- During the Asian trading session, the price of oil continued to rise.
- The price of natural gas still manages to stay in the zone of around $10.00.
- The Organization of the Petroleum Exporting Countries is ready to cut output to correct a recent drop in oil prices.
Oil chart analysis
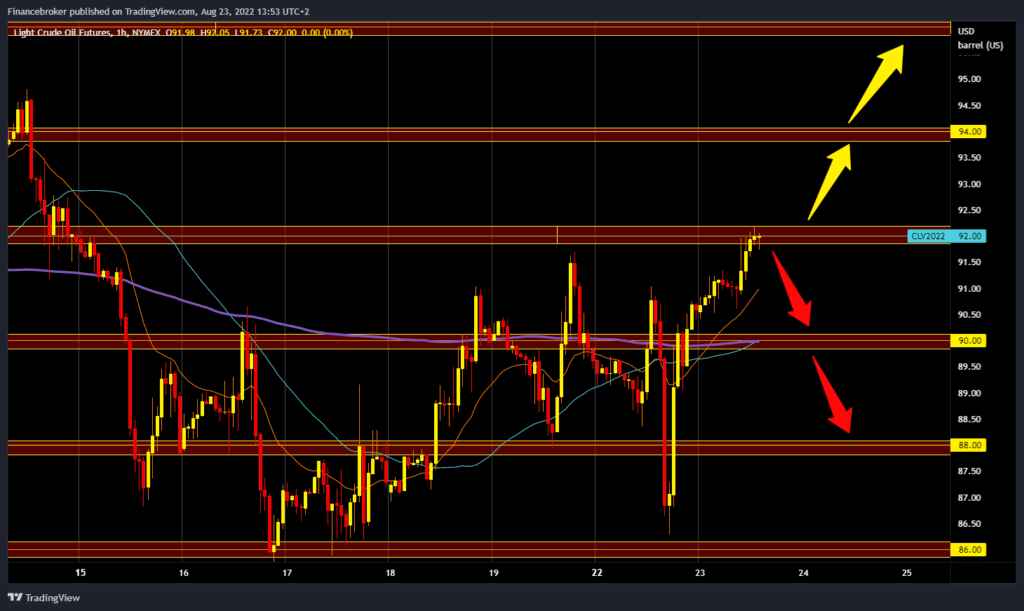
Yesterday, the oil price fell again to $86.25, but it did not stay there for long, and a new jump above the $90.00 level followed. During the Asian trading session, the price of oil continued to rise, and we are now testing the $92.00 level. The moving averages are all on the bullish side and provide support for the price in further recovery. We need a break above the $92.00 level for a bullish option. After that, we must stay above it if we want to continue. Potential higher targets are $93.00 and $94.00 levels. For a bearish option, we need a new negative consolidation. After that, the price would turn towards the $90.00 support level. Additional support at that level is in the MA50 and MA200 moving averages. A break below could take us down to last week’s zone support at the $86.00 level.
Natural gas chart analysis
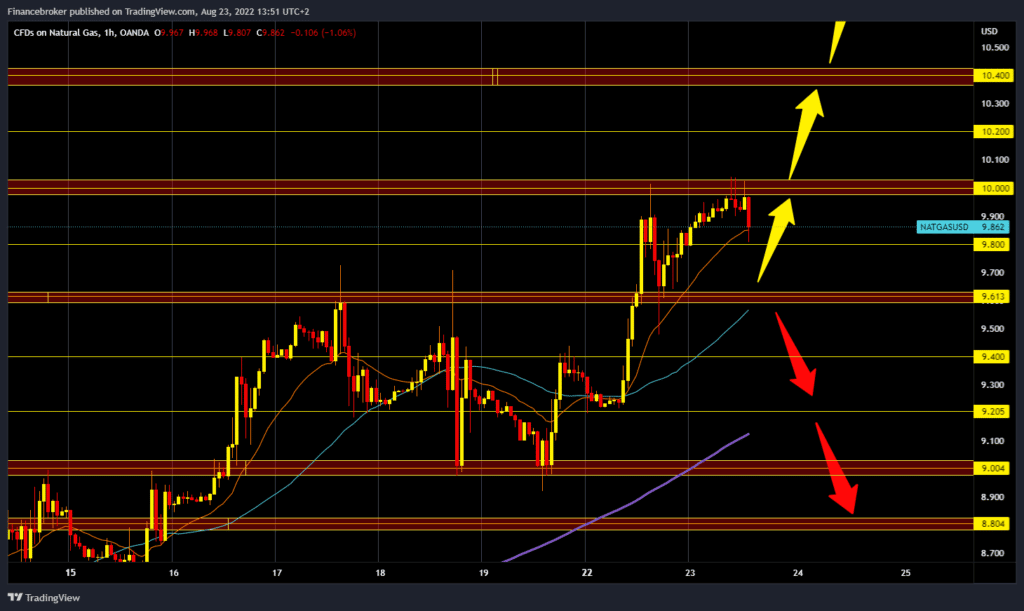
The price of natural gas still manages to stay in the zone of around $10.00. The price of gas fell to the $9.50 level yesterday but quickly pulled back above the $9.60 level and continued during the Asian session once again towards the $10.00 level. Today’s support is at the $9.80 level, and we are now waiting for a new bullish impulse to push the gas price higher above the multi-year high. For a bullish option, we need to break prices above and maintain at that level. After that, we need a bullish impulse to take us to the next higher resistance. Potential higher targets are $10.20 and $10.40 levels. For the bearish option, we need a negative consolidation and a withdrawal of the gas price below the $9.80 level. If that happens, we are looking for the next support at the $9.60 level. Additional support at that point is in the MA50 moving average. Potential lower targets are $9.40 and $9.20 levels.
Market Overview
The Organization of the Petroleum Exporting Countries is ready to cut output to correct a recent drop in oil prices. This is caused by poor liquidity in the futures market and macroeconomic fears that have ignored extremely tight oil supplies, OPEC leader Saudi Arabia said on Monday. Oil rose today as renewed fears of tight supply dominated market sentiment after Saudi Arabia warned that its top oil producer might cut output to correct a recent price slump. This charge was denied by Washington, which said a deal was closer than two weeks ago because of Iran’s apparent flexibility. Europe is facing further disruptions to energy supplies due to damage to a gas pipeline that brings oil from Kazakhstan through Russia, heightening concerns about reduced gas supplies.
The post Oil and Natural Gas: High Volatility appeared first on FinanceBrokerage.


0 Response to "Oil and Natural Gas: High Volatility"
Post a Comment