How Do You Trade a Bat Pattern and How Accurate It Is?

How Do You Trade a Bat Pattern and How Accurate It Is?
Have you ever wondered what bat pattern trading is and how you can trade it most effectively? Whether you are an experienced trader or you still have a long path to go in the world of trading, it is crucial that you know all the important patterns and detailed technical analysis to make your career successful and prosperous.
Specifically, the bat trading pattern is similar to the Gartley pattern, representing a continuation and retracement pattern. It shows once a trend goes in a different direction temporarily but continues in a primary course, it takes.
If you are extremely interested in stock and Forex trading patterns, you should remember that the bat harmonic trading pattern refers to a reversal pattern. It’s famous for following the particular Fibonacci ratios.
But what is so special about the Bat trading pattern? What is essential for traders to know about it? Let’s find out all the basics regarding Bat pattern trading!
What does Bat Pattern Trading represent?
The Bat trading pattern refers to a five-point retracement structure. It was discovered back in 2001 by Scott Carney. It represents one of the most accurate patterns among the diversified Harmonic trading arsenal. Within its structure, its pattern includes specific Fibonacci measurements for each point.
There are numerous distinct elements within the Bat pattern trading. All these elements define a fantastic PRZ, which is short for Potential Reversal Zone. Typically, among all other harmonic patterns, the bat pattern is considered a deep retest of resistance or support that could be very sharp quite often.
The structure of the Bat Pattern trading

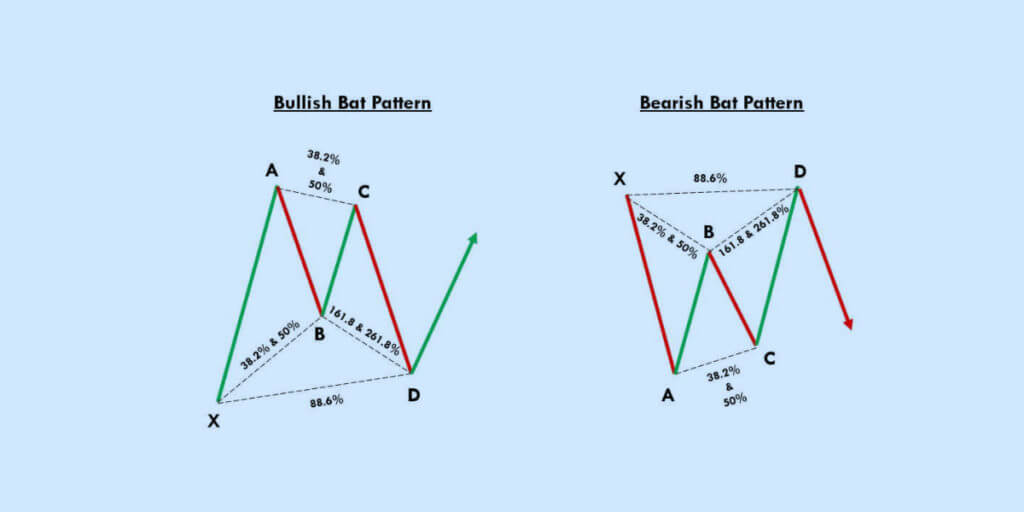
It’s crucial to know that, regarding its structure, that D isn’t a point but a zone where the price is likely to reverse. As mentioned above, we are talking about the Potential Reversal Zone, i.e., PRZ. The B-point retracements of the original XA leg should likely be less than 0.618. The best is 0.382 or 0.50. It’s crucial to know that the Potential Reversal Zone is developed of the three following converging harmonic levels:
- Of the original XA leg: 0.886 retracement
- BC minimum projection: 1.618
- AB=CD extended chart pattern, most commonly 1.27 AB=CD
The 382 retracements of AD could be the first target, while the second one should be the 618 AD retracements. You’ll find a stop-less level, most likely behind the X-point. Traders who consider themselves more conservative should wait for confirmation before proceeding with the actual trading. Remember that bat pattern trading includes two bat patterns:
- Bearish bat pattern
- Bullish bat pattern.
However, we’ll soon get to both bearish and bullish bat patterns when we learn how to identify the Bat pattern trading! Let’s take a look at the most effective identification of it!
How to identify the bat trading pattern most effectively?
Identifying potential trading charts is among the most challenging things in any trading market. Identifying the bat pattern trading chart could be easy once you know all the rules of it. It follows different Fibonacci ratios, and it’s mostly used by advanced traders in the market who can spot it naturally.
The B point that stays beneath the 50% Fibonacci retracements of the famous XA leg is to successfully differentiate Bat pattern trading from a similar Cipher pattern, among other things. In that situation, it’s considered bat pattern trading. On the contrary, it could become a cipher structure.
Fibonacci measurements of the bat pattern

Here are the Fibonacci measurements of the bat pattern that every trader should be aware of:
- Between 38.2% to 50% Fibonacci ratio of the XA leg is when the AB leg retraces
- Beyond the X point, the BC leg increases by 88.6% Fibonacci ratio of the XA leg.
- In the range of 38.2% to 50% of the XA leg is where traders could find B-point retracement.
- The BC price swing represents an addition of 16.18% to 261.8% to 224% of the overall XA wave.
- The 88.6% retracement is the length from X to D point.
- Remember that the famous BC leg is between 161.8% and 261.8% of the CD leg’s Fibonacci retracement level.
Drawing on the MetaTrader 4 platform
Remember that drawing charts are available exclusively on trading charts, so ensure to find the most appropriate one. One of the best platforms for drawing the Bat pattern trading chart is on MetaTrader 4 platform.
In case you wish to apply your Fibonacci tool on this platform, it’s crucial to know that you’re able to mark key Fibonacci levels on your chart. Here is what the bullish bat pattern looks like with the additional levels and retracement that you can see on the B-C and X-A leg:
Learn.tradimo.com source of pic.
What is essential to know before trading the Bat pattern?
If you are really eager to give the Bat pattern a try, before considering so, it’s crucial to know the key elements that you need to check:
- The AB=CD pattern or if there’s an extension of this particular pattern
- X-A leg Fibonacci retracement of 88.6 percent.
- B-C leg’s Fibonacci extension from 161.8% to 261.8%
How to trade the Bat trading pattern most effectively?

Once you’ve learned what Bat pattern trading is and how to identify it the best, it’s time to understand how you’re able to use it. For example, let’s use the Bullish Bat pattern because the Bearish version, the famous short/sell trade, includes inverting the Bullish Bat pattern and all your orders.
Here are the inevitable steps you should take to trade a Bullish Bat pattern:
- Enter your trade: Ensure where is the right place that the pattern will complete at D point. It will be at the X-A leg’s 88.6% retracement.
- Place a buy order like this:
Then it’s time to place a stop-loss in this manner:
Place your profit target.
Once you’ve done so, the next step is to place your profit target. Keep in mind that placing your profit target in bullish bat pattern trading is very subjective. It also heavily depends on two following factors:
- Overall conditions in the market
- All trading objectives.
Nonetheless, it’s crucial to know that it includes drawing a completely new Fibonacci retracement. It should be done from the A to D point of the completed pattern. When you complete the entire drawing of that retracement, it’s advisable to set your profit target at the A-D’s retracement level at 61.8%.
Remember to draw the Fibonacci retracement when the price has reversed, and the pattern has finished at the D point. Take a look at the best example of it in the chart below:
What are the pros and cons?

Here are the main pros of trading a Bat pattern:
- It’s a highly accurate chart pattern
- It includes an excellent risk-reward ratio
- The bat batten provides comprehensible levels for taking profit targets and stopping loss
- It works most effectively for short and long-term traders.
On the other hand, the main cons are the following:
- This particular pattern is not recommended for beginner traders.
- Traders can only expect automatic drawing features on some trading platforms.
Is the bat pattern trading bullish or bearish?

A bat pattern could be either a bullish or a bearish one. It depends on the place it appears on a price chart. It could be either at the bottom of an uptrend or a downtrend. However, if the pattern includes all the Fibonacci ratios and conditions, it’s a harmonic bat pattern.
How accurate is this pattern exactly?
If you are eager to know exactly how the trading bat pattern is accurate, it’s crucial to know that it’s considered one of the most accurate chart patterns in technical analysis. Even though it depends on numerous factors and it’s not 100% guaranteed, the accuracy rate of it is approximately 85%, according to expert analysts.
Key Takeaways
- The Bat pattern represents a continuation and retracement pattern that happens once a trend reverses temporarily. However, it continues in the previous, original direction.
- It includes five points and four price swings.
- To enter a position, it’s crucial to enter at point D.
- This pattern allows traders to enter the market at the best possible price.
- It involves the AB=CD pattern or the extension. It also includes a Fibonacci extension of the B-C leg from 161.8% to 261.8% and the X-A leg’s 88.6% Fibonacci retracement.
- There’s a bullish and bearish version of the famous Bat pattern trading.
- It’s extremely similar to the Gartley pattern. The only difference is that it finishes at an 88.6% Fibonacci retracement of the famous X-A leg.
- To trade a bullish bat pattern, the best is to place the buy order at the D point, which is the 88.6% retracement of the famous X-A leg.
- Below the X point is where traders should place their stop loss.
- From A to D points, drawing an additional Fibonacci retracement from the finished pattern is crucial. Then you’d need to take profit on the distance between A-D, where the price will retrace 61.8%.
- To successfully trade a short/sell trade pattern which is known as a Bearish Bat Pattern, it’s crucial to invert the Bullish bat pattern and all orders.
The post How Do You Trade a Bat Pattern and How Accurate It Is? appeared first on FinanceBrokerage.
0 Response to "How Do You Trade a Bat Pattern and How Accurate It Is?"
Post a Comment