One white soldier candlestick in the Forex – explained

One white soldier candlestick in the Forex – explained
Have you ever wondered what the one white soldier candlestick pattern is? Why is the candlestick chart so popular and widely used among experienced trading professionals nowadays? If you’re one of the motivated traders who want to achieve enviable success in the market, you must understand the most important things about this pattern.
Primarily, the candlestick chart is mostly used by the market traders in the financial sector. During each trading session, this chart shows very clearly the movement in price, making it assume some patterns and shapes. Among numerous patterns, the One white soldier pattern remains among the minority ones, especially financial traders, find beneficial for profiting.
It’s crucial to understand that traders usually utilize this pattern with other tools that enable them to see the key price levels and trend direction. It has some predictive value, and traders use it to anticipate the price movement possibility.
So, let’s find out all about the One White Candlestick pattern, shall we?
What does the One White Soldier pattern represent?
The One White Soldier pattern refers to a reversal candlestick pattern. It consists of two candlesticks since it’s created over 2 trading sessions.
It could probably be one of the following things:
- An broaden pullback in an uptrend
- A Downtrend
- The price swings in the same downtrend in a market that’s range-bound. The pattern will indicate a potential reversal to the upside in whichever direction the downward price move happens.
Generally speaking, the One White Soldier trading pattern is a special kind of pattern that consists of two candles. It enables enthusiastic traders to show the price movement and explain it better.
What does the One soldier candlestick pattern look like?
To successfully identify a candlestick pattern, a trader should know where the pattern forms regarding the total key price levels and price structure. Since it’s a bullish reversal price action setup, this pattern commonly forms in the:
- In a range-bound market on the downswing
- In a downward retracement, a pullback, in an uptrend.
- In a downtrend.
How to recognize the One White Soldier trading pattern?

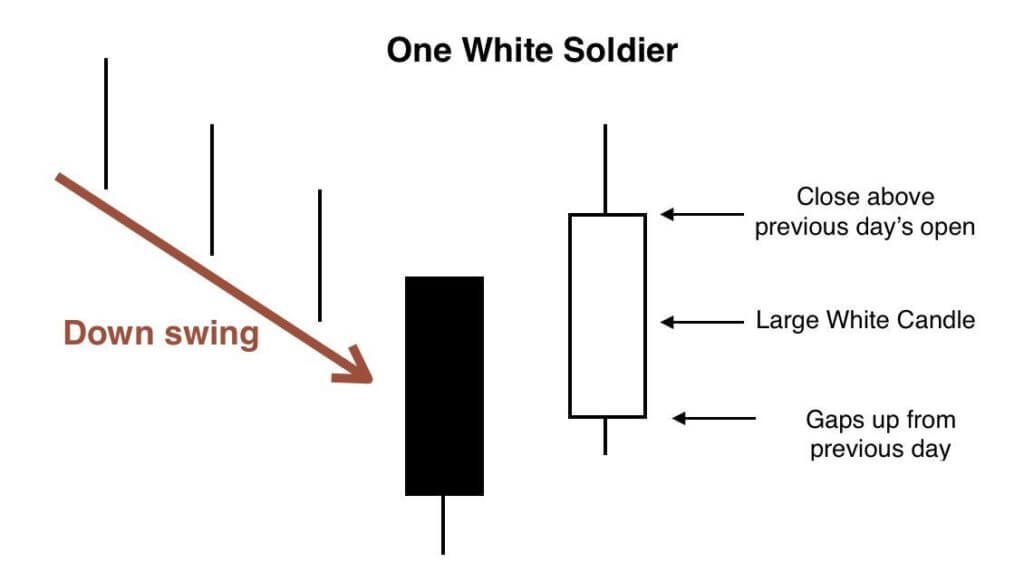
Because we have two candlesticks, where every one of them represents a price movement in one trading session, here’s how you’re able to recognize the One White Soldier pattern:
- A bearish and long candlestick shows up in line with the downward price movement at the end of the 1st trading day.
- A bullish and long candlestick shows up at the end of the 2nd day of trading.
- Within the body of the candlestick of the first day is when the second trading day’s candlestick opens. It closes in excess of its open price.
Remember that the candlestick pattern includes a bearish candlestick that could be any color used to represent bearishness, such as red or black, and a bullish one, usually green, white, or any color used to represent bullishness.
How exactly does this pattern work?
Forex, during the first trading session, that’s like the normal continuation of the present downward price movement. It starts with a bearish candlestick. The following trading session opens above closing levels of the candle before it. It goes upward where it will close just by the huge level.
Keep in mind that the open price is below the closing price in the former session. Because one trading session could last from an intraday time frame, one day to a month, in every session, the movement of price is graphically represented with a candlestick.
Regarding the One White Soldier pattern, we’ve got 2 candlesticks in a row with long bodies and opposite colors.
Swing traders use it for some swing strategies.

Because the One Soldier candlestick pattern usually indicates the conclusion of a pullback and the disclosure of a new pulse swing in a trend, numerous swing traders utilize it to create valuable swing trading strategies.
These strategies could be either one single price action pattern or in combination with numerous other trading tools that could improve the trade setup odds.
What other criteria does the One White Soldier candlestick pattern include?
Besides all, there are other criteria that this particular trading pattern includes, and these are:
- A downtrend, a downswing, or a prolonged downward retracement usually characterizes the market.
- Candlesticks’ length mustn’t be short. The first and second candlesticks need to be long ones.
- The second candlestick has to close right by its high
- Above the close of the previous price of the first day, the second day needs to open there and climb to close above the first day’s opening price.
The body height of a long candlestick should be greater than the previous 20 candlesticks’ average body height. The One White Soldier Candlestick pattern is probably going to be around the support level.
So, as mentioned above, we are talking about the Bullish One White Soldier pattern that represents the pattern that shows up in a downtrend. It includes one black and one white candlestick, where the white candlestick gets open above the former day’s close, closing above its open later on.
Why is the One White Soldier candlestick pattern so important?

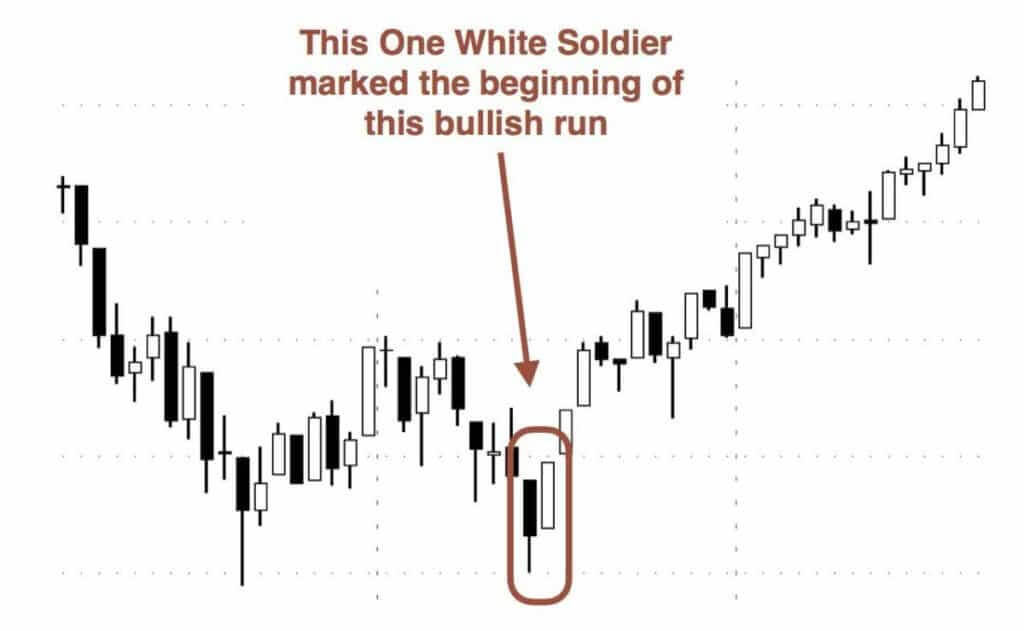
One of the main questions among many traders is why is the One White Soldier candlestick pattern so crucial. First of all, it indicates one of the most important things: a bullish price reversal. In most cases, these patterns are used by motivated action swing traders.
When it happens in an uptrend’s pullback, it might be less effective when it comes to predicting a reversal of a full trend. However, it is expected to indicate the end of that pullback and a new impulse wave going in the trend direction. It could be one of the most beneficial opportunities for motivated swing traders.
The One Soldier candlestick pattern is more valuable if it happens at a support level. Regarding the range-bound market, we could spot this pattern at the lower boundary of the range, at the end of the downward price swings. It’s undoubtedly, a support zone we’re talking about.
In this case, the One White Soldier candlestick pattern signals a probable end of the downswings and also the next upward price swing start. The pattern will display the downward price movement in any case.
What is the point of the One White Soldier Candlestick Pattern?
As learned from above, the One White Soldier candlestick pattern usually forms a downward price swing. The downward price move ends with a long bearish candlestick. It’s the first one in the pattern.
Traders can also observe the bearish candlestick as a selling climax that implies that bearish sentiment is sold, and there wouldn’t be numerous bears to push the price lower. It could also be observed as a capitulation of a form. The bulls could take advantage of the opportunity to control the market.
The One White Soldier Candlestick Pattern usually happens around that support level. In that level, there’s a great need level in the form of numerous buy limit orders. Once the price reaches that level, the bears throw all they possess to take out all buy orders and then break below the level. However, they’re unable to do so.
This inability emboldened the bulls on the sideline with enormous buy market orders that flooded the market. There’s also the inability to assist these bears, except for letting bulls lead to the bullish price reversal.
Remember that there’s a factor that contributes to the pattern’s formation. It’s called the “dead cat bounce” effect, right after the price decline prolongation. All early sellers are giving their best to cover their shorts, trying to avoid the swift price reversal.
Key Takeaways
- The One White Soldier Candlestick pattern is a bullish pattern consisting of two candlesticks.
- It is identified in the configuration of two different candles where. The first one is bearish and long, indicating the continuation of a downtrend, while the second is bullish and long.
- In this case, the second candle is open within the body limits of the first candle. It also closes above the first candle’s opening.
- The input parameters are length which is the number of candles that calculates the average body high. The candle is long if its body height is greater than the average one. Another parameter is the trend setup. It’s the number of preceding candles to see if a downtrend happens before the pattern.
Do candlesticks work in the Forex market?

If you were wondering whether the One White Soldier Candlestick pattern or other patterns work in the Forex market, you should know that candlestick charts are very useful tools. They help traders better understand the price action and order flows in the foreign exchange market.
It’s also crucial to know that, in Forex trading, history repeats itself regarding candlestick patterns. All patterns and repetitions in the Forex historical data are vital parts for forecasting in Forex, generally. Besides the One White Soldier pattern, other patterns that are worth and good for trading are:
- Wedges
- Double bottom
- Rounding bottom
- Descending triangle
- Symmetrical triangle
- Head and shoulders
- Cup and handle
- Ascending triangle
- Double top
- Flags or pennant
Whichever pattern you choose to try using, do it patiently and wisely! Good luck with your trading in the Forex market!
The post One white soldier candlestick in the Forex – explained appeared first on FinanceBrokerage.
0 Response to "One white soldier candlestick in the Forex – explained"
Post a Comment