What is Dragonfly Doji and How to Trade?
What is Dragonfly Doji and How to Trade?
There are quite a few Doji Candlesticks you can refer to in your technical analysis. Mastering their interpretation and knowing how to implement the info into your trading sessions is vital for your trading success. Do you know the Dragonfly Doji Candlestick? It’s a Japanese candlestick pattern mostly known to day trading currency traders. This pattern is a recurring configuration. It is repeated quite often on financial charts, so it is possible to see a trading signal and an investment opportunity.
Keep reading if you are eager to learn more about this Doji Pattern. We explain everything from dragonfly Doji’s meaning and interpretation to the ways of implementing this indicator in your trades.
What is a dragonfly Doji candle – Understanding the dragonfly Doji
What does Dragonfly Doji mean concretely? This Japanese candlestick means that there is a downward trend, and a bullish corrective movement followed this. Sellers had the upper hand at the start of the session. However, the buyers took over the market at the end of the day. At the close of the Dragonfly Doji, buyers, therefore, still have control over the market. So what should we do if we observe a Dragonfly Doji? That’s right! You have to buy the market.
How to spot Dragonfly Doji Pattern?
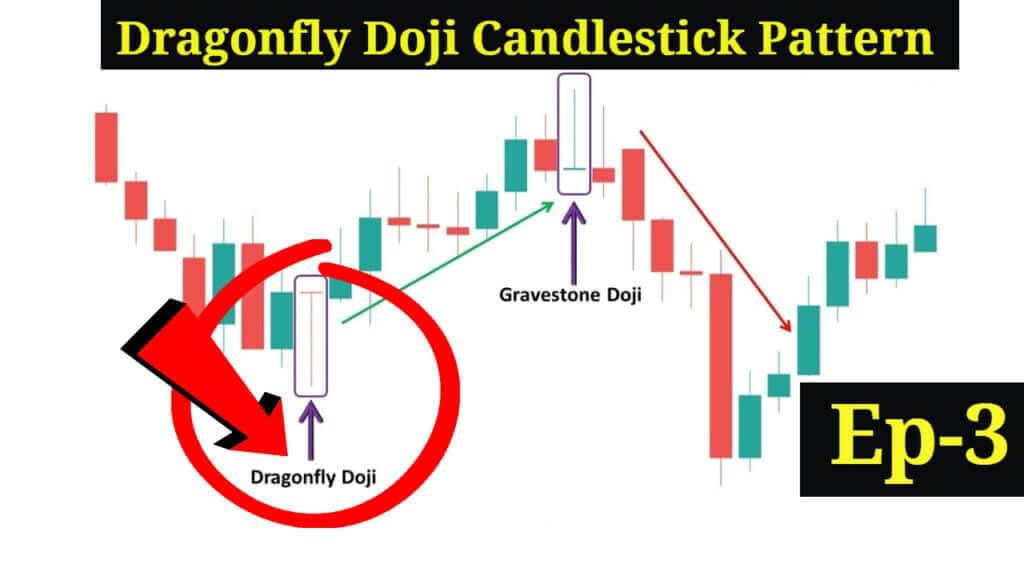
The Dragonfly Doji is a relatively easy chart pattern to spot in the sense that the Japanese candlestick’s close price is equal (or nearly equal) to its open price. If we base ourselves on a forex chart in daily time units (daily – D1), and if the market opens at a certain price level, the price collapses by 100 pips, but at the end of the day, it rises sharply until the opening price then a Dragonfly Doji will be formed.
How to interpret the Dragonfly Doji Candlestick Chart?
When the trading session begins, the sellers (bears) aggressively push the price down. Graphically this translates to the long wick under the body of the candlestick.
The behavior of the sellers indicates that some investors are liquidating their positions and selling their securities during a bull market. In contrast, in a bear market, this action by the sellers implies nothing but a continuation of the trend.
In the middle of the session, the buyers (bulls) regain control over the buyers (bears) and manage to bring the price up to the level of the opening quotation. Buyers thus regain the entire decline ceded earlier.
In a bear market, the action of buyers (bulls) implies that a portion of investors exits short positions. Others enter the market, probably thinking that the price has bottomed out.
At closing, the security price has returned to the starting point. Buyers (bulls) were not strong enough to push the stock’s value above the opening price. We thus deduce the indecision of the investors.
Graphical representation of the Doji Dragon.
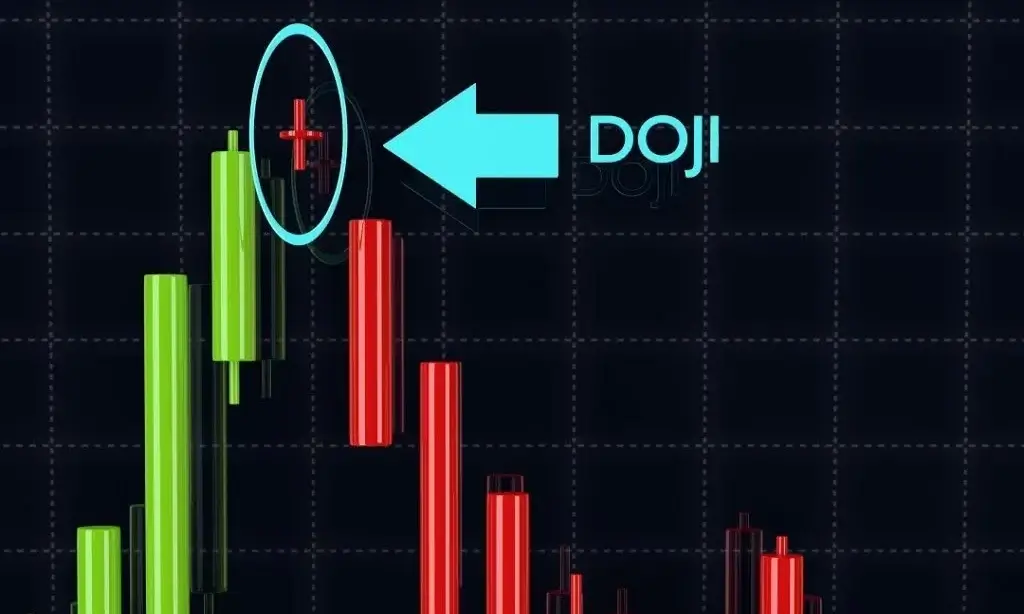
This very particular Japanese candlestick is composed of a long lower shadow which reflects the bearish reversal action of sellers (bears) at the start of the session.
The body is placed in the upper shadow. This singularity indicates that the opening and closing prices are equal or almost at the high of the session.
Keep in mind that the size of a candlestick is relative and should be interpreted concerning previous candles.
The Dragon Doji is the perfect horizontal symmetry of another Doji, the Tombstone Doji.
The Dragon Doji has the same shape as the letter T. Just like the other Doji, it is made up of a small body. However, this one, which makes the candlestick special, is placed at the top of a long wick.
The open and close should be nearly equal or close enough in value that the candle’s body looks like a horizontal line.
When the trends are no longer close enough to graphically form a line, the candlestick is called Hammer.
The Doji Dragon forms when the opening and closing prices match the high of the session. The long wick below the candle’s body suggests that the sellers (bears) were particularly aggressive in the early part of the trading period.
Bearish Dragonfly Doji
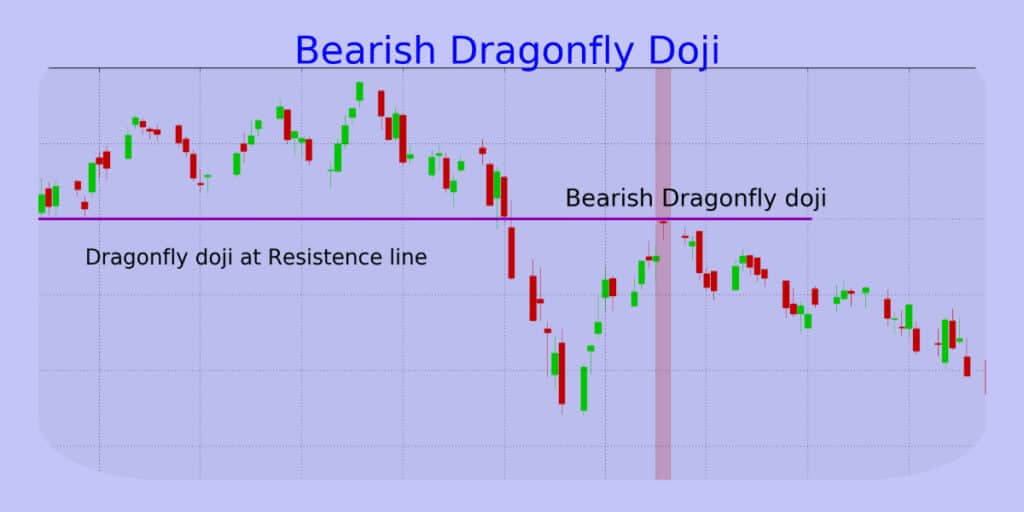
The Japanese candlestick pattern Dragonfly Doji, ‘the bearish dragonfly doji (dragonfly Doji bearish),’ is part of the candlesticks announcing uncertainty among stock market participants. It is a figure of indecision.
This pattern appears when the opening prices and closing prices are at the same level and when the low is significantly lower than the open, high, and close prices.
Bearish dragonfly Doj candlestick pattern appears in an uptrend.
It is characterized by strong selling pressure when the market opens.
Prices will go much lower than the open price and then close the day close to or at the open price.
Bullish Dragonfly Doji
This pattern appears when the opening and closing are at the same level and when the low is significantly lower than the open, high, and close.
Devoid of an upper shadow, this rather rare candle is composed of a long lower shadow and an opening/closing price at the highest.
In a bearish phase, it will be a bullish reversal signal; the strength of the signal will be all the more increased as, the lower shadow will be long.
This candlestick pattern appears in a downtrend.
The inability of the market to continue its downtrend reduces the bears’ negative sentiment. Now, sellers are in an increasingly critical situation.
This concern of the bears will allow the buyers to regain the upper hand in the market, so the sellers will be forced to buy back their short positions.
How to trade using Dragonfly Doji

When Dragonfly Doji appears on a price chart, this candle is a signal that should alert to a probable change in the trend, namely a bearish or bullish reversal.
However, as with all patterns of a single candlestick, one or more confirmation candles are required.
In an uptrend, the confirmation candlestick should be a bearish candle closing below the Doji Dragon low. When the confirmation candlestick is bullish, it suggests more of a continuation or a break in the trend.
In a bearish reversal trend, the confirmation candlestick must be a bullish candle whose close is very clearly higher than the closing price of the Doji Dragon. A bearish candle will be a signal to continue or break the trend.
The likelihood of an upward reversal in a downtrend following a Dragon Doji will be proportional to the strength conveyed by the length of the confirming candlestick body.
To be valid, confirmation candlesticks must be accompanied by strong volumes. Strong volumes accompanying the Doji Dragon also considerably strengthen the signal.
However, like all Doji, the Dragon Doji reflects some form of market indecision or hesitation. Thus, despite confirmation signals, the price may continue in the direction of the trend.
The reversal announced by Doji Dragon is purely random. Statistics show that a reversal only occurs in 50% of cases. It clearly confirms the indecisive nature of the candlestick.
The Doji Dragon is, therefore, no exception to the general rule of Doji. This candlestick is often a sign that investors do not know which direction the market should take.
Advantages of implementing Dragonfly Doji in your tech analysis
There are several advantages to the Dragonfly Doji. First, this chart configuration marks the end of a downward trend movement. That means one can enter an upward position by setting a tight stop loss and taking a relatively low risk. The stop loss can be set on the low of the Japanese candlestick representing this graphic pattern. Moreover, when we observe this recurring pattern, we feel the buying pressure, and therefore we can position ourselves quite serenely on the purchase. The probability of leading to a profitable trade (or, in the worst case, breakeven) is very high.
Dragonfly Doji Candle – Key takeaways
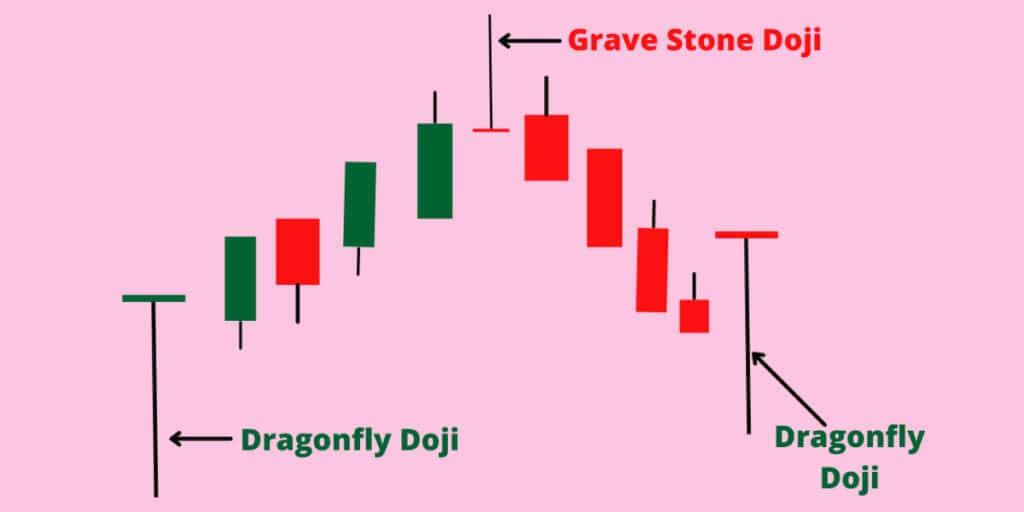
A dragonfly Doji pattern appears after a price uptrend or downtrend.
The close, high and open prices match each other.It refers to a potential reversal in the market.
It refers to a bearish or bullish reversal. Before taking action, you must wait for the strong signal and consider other indicators.
Whatever type of Doji you encounter in the markets usually means that the sentiment is mixed. Neither the bulls nor the bears had the upper hand by the end of the session, despite any price action.
On a flat or range chart, this may not provide much to go on. But if you spot a Doji in a strong trending market, it could be a sign of waning momentum and a possible reversal imminent.
In order to make the most accurate prediction, you should use other indicators. These are MACD, Bollinger Bands, Stochastic, Ichimoku Kinko Hyo, Fibonacci, Average True Range, and others. Make sure to always take into consideration two or three different indicator categories. That way, you are certain that you are getting the most precise trading signal. It’s especially important in the market, showing the indecision of the traders
The post What is Dragonfly Doji and How to Trade? appeared first on FinanceBrokerage.
0 Response to "What is Dragonfly Doji and How to Trade?"
Post a Comment