Bearish expanding triangle – definition, and application

Bearish expanding triangle – definition, and application
Have you ever heard of expanding triangles in trading chart analysis? If not, we are here to explain its usage. To trade effectively, it is important to do a graphical analysis of the market price. Chart patterns are a good way to read charts that can have predictive value. Thus, there are different chart patterns that can indicate continuation and/or reversal patterns. Triangles make it possible to announce the market trend and the actions to be taken in the face of this trend. Discover in this article all our explanations for bearish trading triangles and how to trade them on financial markets.
Triangle patterns explained
The triangles start with an area where prices move fairly wide as if the traders were waiting for a signal or an event to make a decision.
Triangles are very powerful tools in technical analysis. They allow, in some cases, to predict the future direction of the market or a value with fairly specific objectives.
To confirm the trend, the triangle exits must be done with high volumes. If the transactions are small, the objectives cannot be reached, or the exit could be a false start.
There are different types of triangles. Some allow you to guess the future trend from their shape, while others are more difficult figures to interpret.
These triangles are continuation patterns, i.e., it is an intermediate phase in the evolution of a value that will strengthen the current trend. At least three points must confirm each line making up the triangle.
The ascending triangle is composed of a roughly horizontal resistance line and a fairly strong bullish support that allows it to return to resistance each time and then break it.
Triangles are continuation patterns that give the opportunity to take an ongoing trend. An exit from a triangle with volumes returning before the last third of the pattern gives a buy signal, quite popular with chartists, with a stop generally located inside the triangle.
In general, these graphic figures allow traders to identify trends, reversals, or confirmations. Several potential variations of triangles can develop when price action carves a holding pattern, namely bullish, bearish, symmetrical triangles, and bullish and bearish expanding triangles. Before we see what a bearish expanding triangle pattern represents, let’s see what expanding triangle patterns are in trading.
Expanding triangles explained
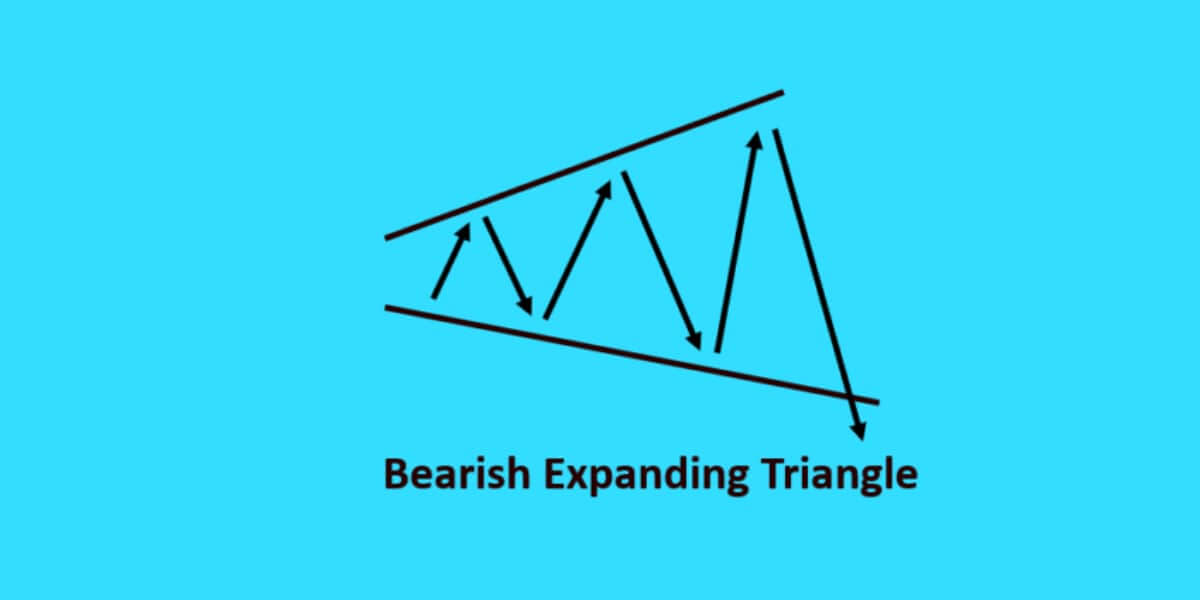
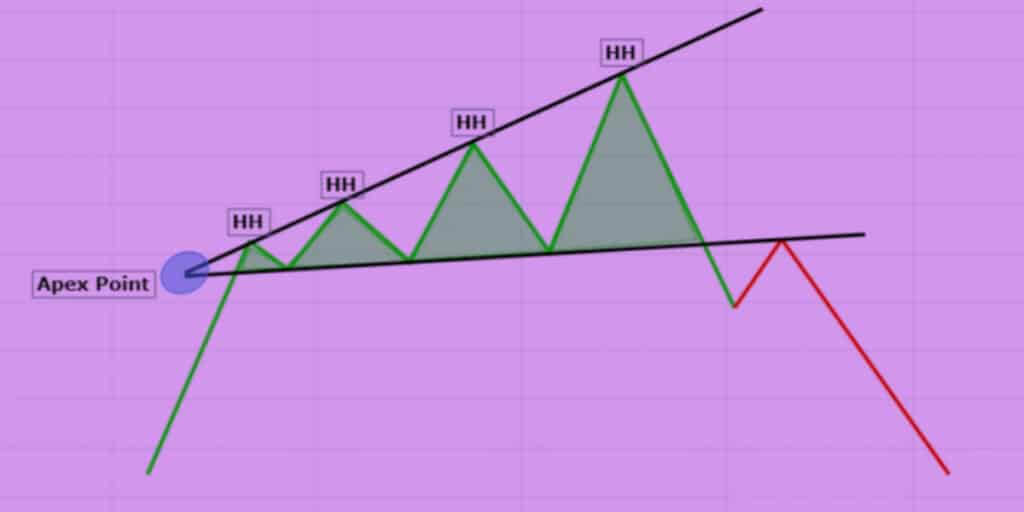
This technical analysis pattern applies to all financial markets but mostly to the highly volatile ones. Many debates regarding this pattern see it as a reversal pattern, a trend continuation pattern, difficult to spot. Depending on the market environment, it can be bullish or bearish. It consists of many lower lows and higher highs. Expanding triangles have different durations. Usually, they list two swing lows and two swing highs in prices.
The ‘tomahawk’ appearance of the expanding triangle is the mirror image or flipped in direction compared to the symmetrical contracting triangle. The symmetrical or isosceles triangle is composed of two lines, one bullish and the other bearish. The two lines are roughly equivalent. The triangle, to be valid, must have at least four impacts, two on each line.
A symmetrical triangle takes shape after a strong upward or downward movement. During this period, participants in the market are wondering what trend to give to the market. The main use of this triangle is to give a precise objective of the movement during the exit. Inside the triangle, it is very difficult to guess the trend at the exit, but when the exit is made, one can easily give an objective.
To be valid, the exit in this kind of configuration must be done before the last quarter of the triangle (symbolized by the dotted lines). If the exit is done after, the figure is no longer valid, and the signals given will be false or unreliable.
Types of market trends
Before analyzing the charts and figures that may form, it is important to know the basics of technical analysis. These are the types of trends that can emerge in the markets. From these trends, it will be easier to understand the chart patterns and the effective trade techniques.
Rising prices and lower volatility mark the upward trend or bull market. The trend is up when the indexes or stock’s value has risen 20% from the most recent low point.
On the other hand, a downward trend or Bear market is marked by falling prices and greater volatility. This is more specifically the case when the value of the index or stock has fallen 20% from the most recent high.
Finally, the horizontal trend or Fish market is marked by a flat trend, corresponding to a certain neutrality. The daily movements are important but remain contained within a horizontal channel.
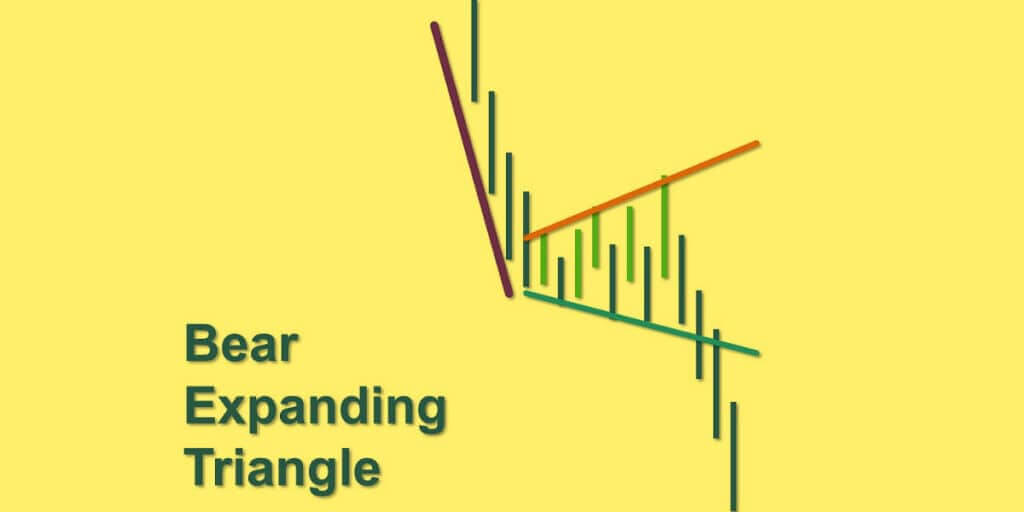
Bearish expanding triangle explained.

It’s a continuation pattern, usually formed in a downtrend, that serves as a confirmation of the existing direction. This pattern is represented by the price close to narrowing between the high and low prices, visually forming a triangle. The main feature of this type of triangle is usually having a descending-ante trendline (resistance), connecting ever-low and lower highs and horizontal trends (support), and connecting lows at approximately the same level.
This kind of triangle must be confirmed by the volumes: modest during the formation of the triangle (period of consolidation and indecision), and the volumes must increase during the breakout. If this is not the case, it means that the speakers remain in the background, and the signal will then lose all its meaning.
The renewed volume is not the only condition to validate this configuration. The exit from the triangle should be about two-thirds from the end of the triangle. Beyond that, the relevance of the configuration is called into question because a triangle that persists reflects investor apathy with the risk of seeing the value “sluggish” up to the peak and sometimes beyond.
Bearish expanding triangle – how to trade
It’s a bearish chart pattern useful for spotting the reversals and continuation of an upward trend. It’s quite a rare pattern, and you can identify it only in highly volatile markets such as Forex. Bearish expanding triangle occurs in all time frames. The higher highs and lows strongly oscillating points out that the market is highly volatile.
When to open a position in a bearish expanding triangle? At the break out of the price action through the support level, you should take the first entry. It shows the sellers on the market dominate, and the prices keep dropping. You should put it at the beginning of the breakout candlestick when it comes to stop loss.
As we have indecisiveness in the market, the market is highly volatile, and the buyers dominate the market. The price action can break the resistance levels continuing the current trend. In this case, you should go for an open buy order at the end of the breakout candlestick.
So, where to put your stop loss order in the Bearish triangle with a bullish breakout? Go for a stop-loss order at the end of the breakout candlestick.
A bearish expanding triangle is composed of a bearish resistance and horizontal support. The resistance ends up pushing the value.
The volumes in all cases should decrease over time. The further you go in the triangle, the lower the volumes become. Volumes must regain momentum at the triangle exit to validate the objective.
The objective is calculated in the same way as for the isosceles triangle, it is possible at the exit of the triangle that the value tests the line crossed upwards or downwards, but this does not call into question the trend.
Bearish expanding triangle – The bottom line

It’s a continuation pattern, usually formed in a downtrend, that confirms the existing direction. This pattern is represented by the price close to narrowing between the high and low prices, visually forming a triangle.
It’s a bearish chart pattern useful for spotting the reversals and continuation of an upward trend. It’s quite a rare pattern, and you can identify it only in highly volatile markets such as Forex. Bearish expanding triangle occurs in all time frames. The higher highs and lows strongly oscillating points out that the market is highly volatile.
Ultimately, as with any technical indicator, the successful use of bearish expanding patterns is a matter of patience and due diligence. Although this triangle pattern tends towards certain signals and indications, it is important to remain vigilant and remember that the market is not known to be predictable and can change direction quickly.
That’s why wise traders observing what looks like a triangle pattern wait for confirmation of the breakout by price action before taking a new position in the market. Also, remember that triangle patterns usually don’t form very clearly. Lines that form a triangle configuration can be a bit more jagged and not quite as straight.
In conclusion, we can say that triangle chart patterns are useful for trading effectively. Before any pattern is formed, it is always important to be aware of the direction of support and resistance as well as the direction of the underlying trend. We must also not forget to refer to traditional indicators in addition to these chart figures.
The post Bearish expanding triangle – definition, and application appeared first on FinanceBrokerage.

0 Response to "Bearish expanding triangle – definition, and application"
Post a Comment