12 May chart overview for oil and natural gas

12 May chart overview for oil and natural gas
Oil chart overview
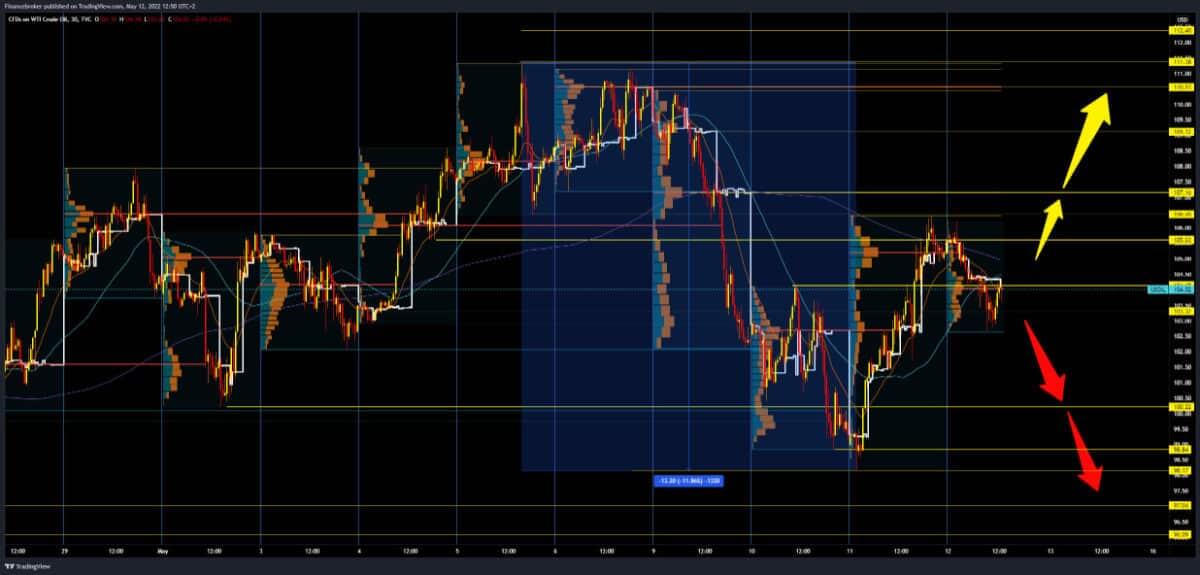
During the Asian session, the price of crude oil recovered after a milder withdrawal than yesterday. As the European session began, the oil price began to fall, from $ 106.23 to $ 102.60. An official government report on the state of stocks showed yesterday that crude oil stocks in the USA increased by 8.5 million barrels. The political harmonization of the representatives of the EU member states has not yet borne fruit, but it continues. Attempts are being made to persuade Hungary to agree to an oil embargo on Russia through financial compensation and reach a solution by meeting foreign ministers scheduled for May 16. Since we have bearish pressure on the price today, and we can expect the price to continue a pullback to $ 100.00 in psychological support. Yesterday’s minimum was $ 98.17. For the bullish option, we need better consolidation and a break above $ 105 if we plan to test the $ 106.50 level again.
Natural gas chart analysis
Open interest in natural gas market futures fell for the fifth session in a row on Wednesday, this time for about 3.2 thousand contracts, according to data from the CME group. The volume followed that and added the previous version and dropped sharply by about 161.2 thousand contracts.
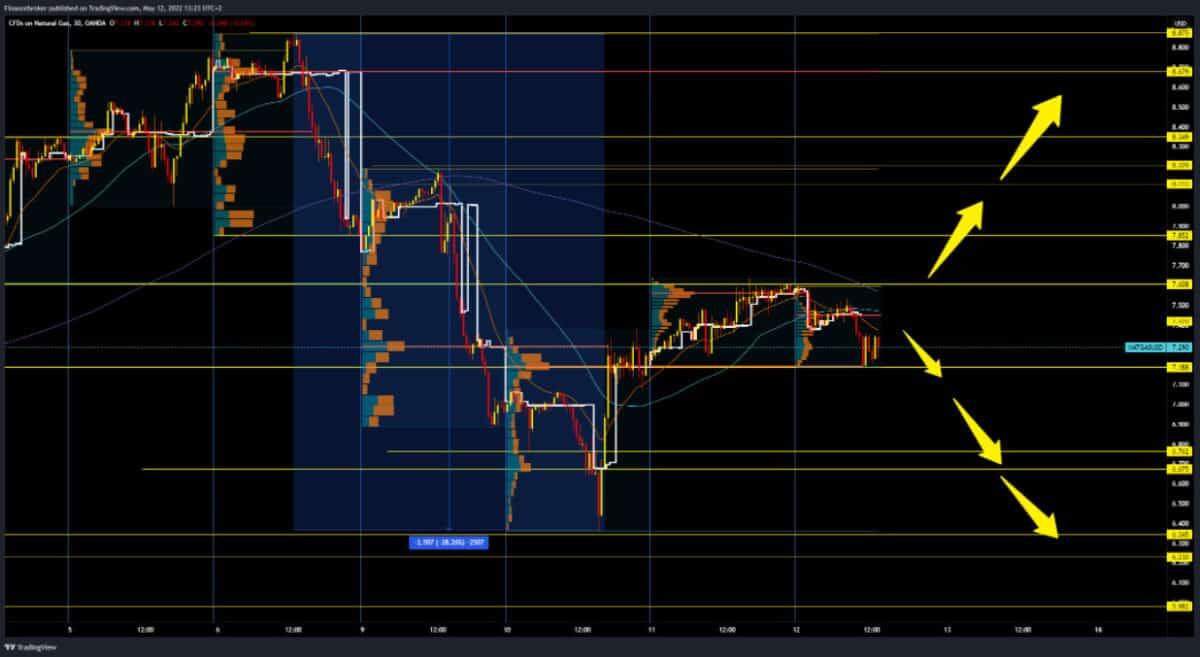
Natural gas prices advanced slightly on Wednesday, although the move was the opposite of declining open interest and volume. Such a picture would mean that further power could disappear in the very near future. Today’s support is at $ 7.18, and we can see that there is increasing pressure on that support zone. A break below would open up space down to this week’s low of $ 6.35. For the bullish option, we need a price refund of up to the $ 7.61 resistance zone. A break above would boost the bullish momentum and direct us to the upper resistance zone of $ 8.10-8.20, this week’s high.
Market overview
The IEA is revising oil demand growth projections
In its monthly report on the oil market, the International Energy Agency (IEA) revised its projections for the growth of oil demand for this year by 70,000 bpd due to the Chinese blockade and high prices.
Italian Prime Minister Draghi now supports paying in rubles for Russian gas.
As the European Union warns companies not to pay for Russian gas in rubles, the Italian Prime Minister said the opposite, saying that European companies are free to pay in Russian currency without violating sanctions that lack clarity. “There is no official statement on what it means to violate sanctions,” Draghi told a news conference on Wednesday. “No one has ever said anything about whether the sanctions for violating payments are in rubles.
The Italian Prime Minister also claimed that “most gas importers” have already opened ruble accounts with Russian Gazprom.
On Tuesday, VNG, one of Germany’s largest importers of natural gas, allegedly opened an account in rubles with Russia’s Gazprombank. According to Russia’s sanctions circumvention scheme, its payment in euros will be converted into rubles.
The post 12 May chart overview for oil and natural gas appeared first on FinanceBrokerage.


0 Response to "12 May chart overview for oil and natural gas"
Post a Comment