12 May chart overview for gold and silver

12 May chart overview for gold and silver
Gold chart analysis
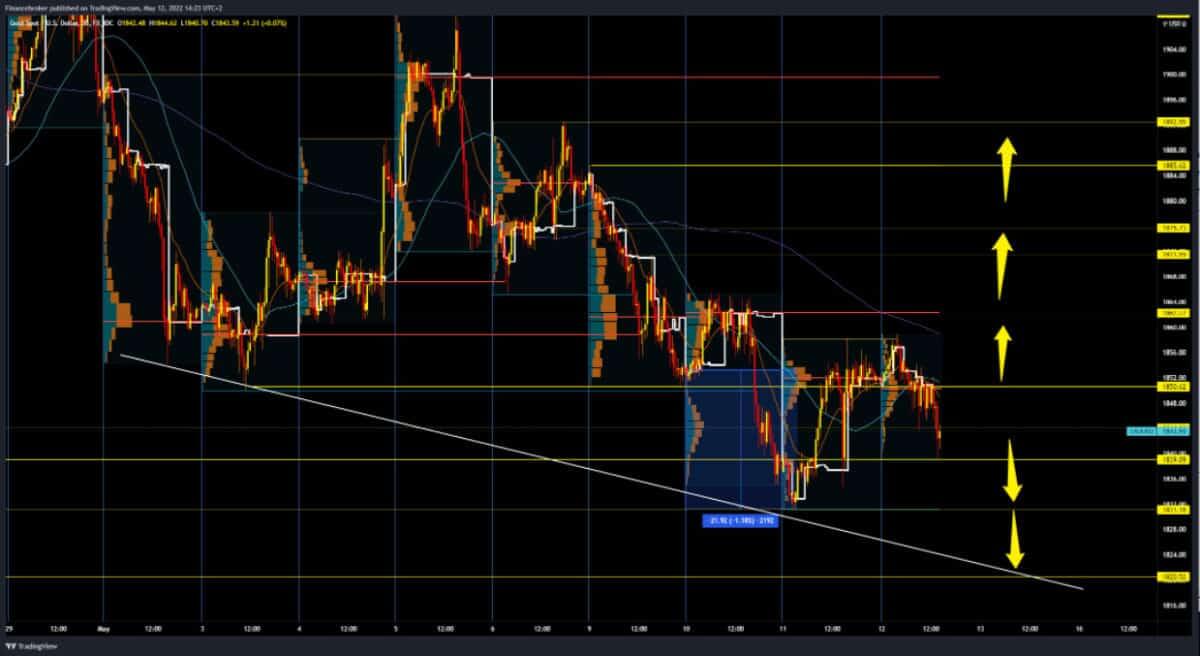
During the first part of the Asian session, the price of gold was rising and stopped at 1860 dollars. This was followed by a pullback and a drop in price to 1839 dollars. A strong dollar could further lower the price of gold first to yesterday’s low of 1831 dollars. We are targeting the next potential support at $ 1820 and then $ 1810 levels. We need a refund above the $ 1865 zone for the bullish option. Such a move would confirm that the price formed the bottom and continued on the bullish side. Bullish targets are $ 1871, $ 1875, $ 1885 and $ 1892 level.
Silver chart analysis
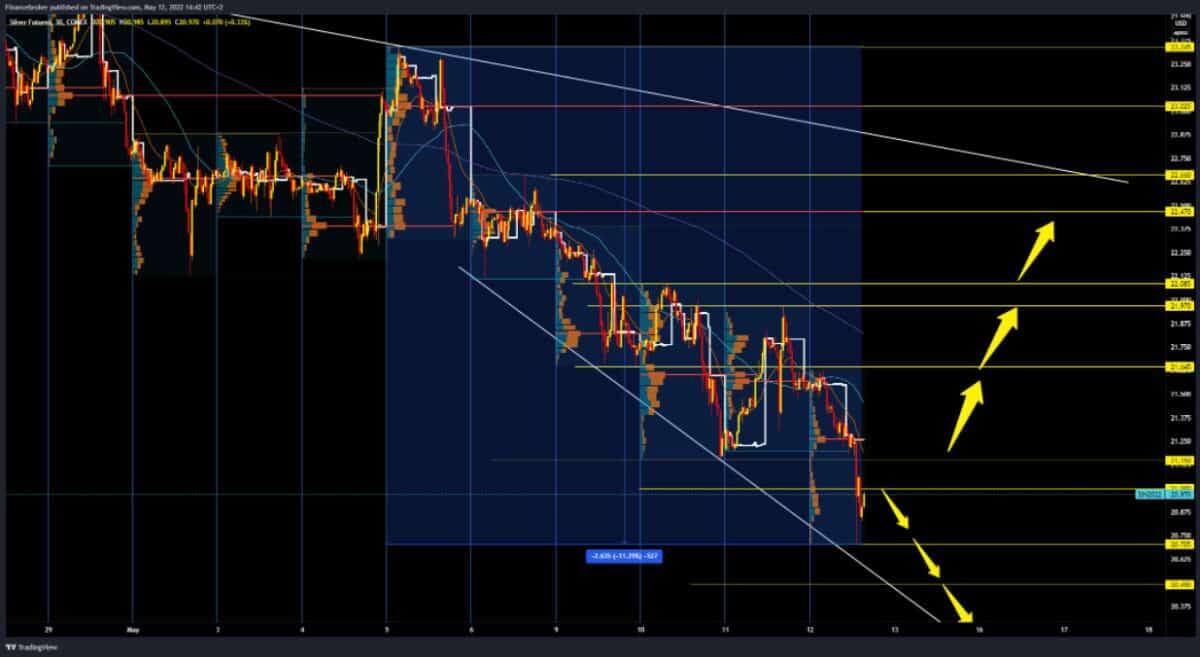
The price of silver continues to fall, losing an additional 3.15% today. This morning’s and May’s minimum was stopped at $ 20.70. After that, we had a shorter recovery, but without success, because the price is again in negative consolidation with a view to the previous lower low. Potential lower support levels are $ 20.50, then $ 20.25 level. For the bullish option, we need a new positive consolidation and a price jump above $ 21.25. Then we can hope that prices will continue to recover with some positive consolidation. Our first target is yesterday’s high at $ 21.97, then $ 22.10. The maximum target and resistance in this time frame is the upper resistance line at $ 22.66.

Market overview
Currently, the U.S. and global yields are lagging behind in the midst of a safe-haven offer, and lower yields mean lower opportunity costs of holding non-yielding assets like gold. Concerns about the slowdown in global growth remain, while European markets remain shaken by the latest geopolitical developments.
Finland is on the verge of submitting a request to join NATO, and Sweden is expected to follow suit. Russia has an uncertain answer for now. Geopolitical tensions in the region are contributing to the growth of negative risks, and all that could lead investors as reasons to buy gold. The forthcoming release of U.S. producer price inflation data for April will be noteworthy, as will any further rhetoric by Fed policymakers.
The post 12 May chart overview for gold and silver appeared first on FinanceBrokerage.

0 Response to "12 May chart overview for gold and silver"
Post a Comment