Doji Star Candlestick Pattern – How to Use it

Doji Star Candlestick Pattern – How to Use it
Have you ever thought about what a Doji Star represent and looks like? Why does everybody seem obsessed with using the Doji star candlestick pattern nowadays, and how can it improve your trading in the long run? After all, how are you able to use it as a devoted trader?
So many questions revolve around such a simple thing as Doji Star. However, for all those newbies who have just stepped into trading stocks intending to earn profits, such a thing may still be unknown.
To fully understand what the fuzz is all about, it’s crucial to know the fundamentals of the Doji Star in the first place, beginning with the definition of the term “Doji”. So, let’s help you get all the beneficial information regarding Doji Star Candlestick Pattern in order for you to start using it as soon as possible and, thus, increase your income!
Definition of Doji – explained by professionals
The term “Doji”, or to be more precise “dо̄ji”, is a term of Japanese origin. It represents a session where the candlestick for security includes an open and close virtually equal and, in most cases, are components in patterns. Doji, alone, describes neutral patterns that are featured in numerous crucial patterns.
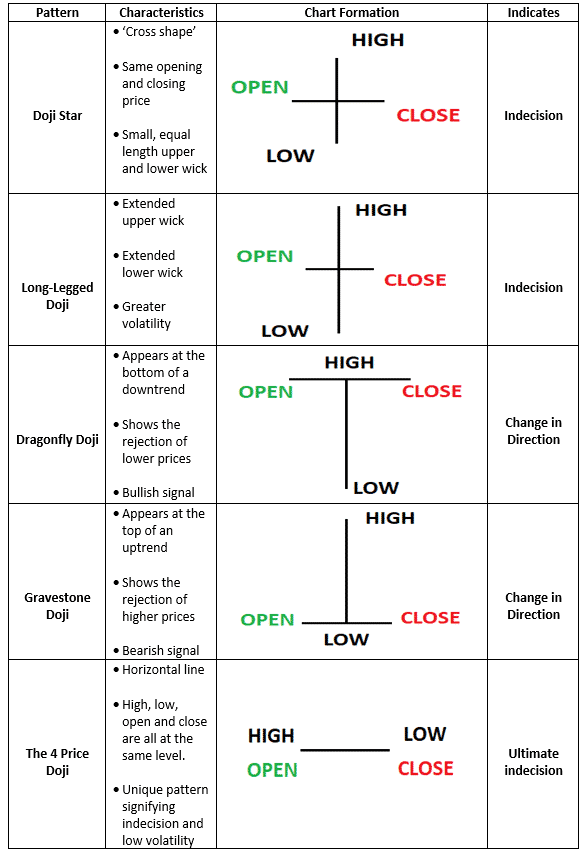
The Doji candlestick actually looks like a plus sign, cross, or inverted cross. It is formed once a security’s open and close are equal virtually for some given period, and it generally signals a reversal pattern for tech analysis.
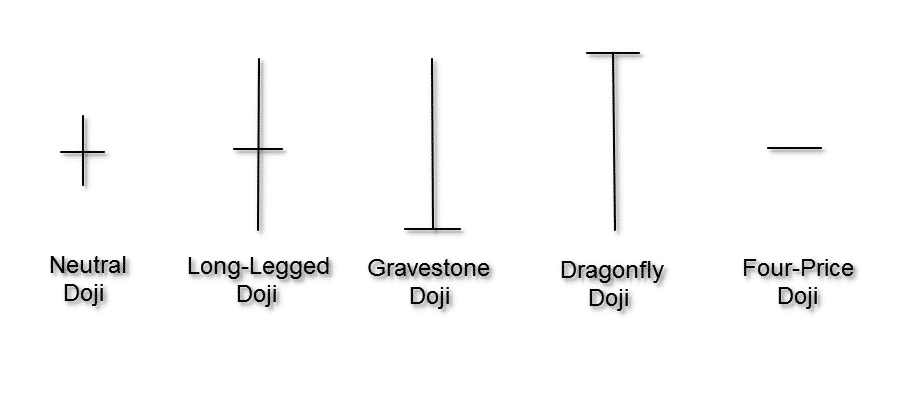
It is able for Doji to form in the following variants:
- Neutral Doji
- Long-Legged Doji
- Gravestone Doji
- Dragonfly Doji
- Four-price Doji
Understanding what Doji tells you
Many technical analysts think that all information regarding a stock is reflected in the price. It means that the price is “efficient”. However, the actual stock price may have nothing to do with its intrinsic, absolute value or future price performance.
Thus, technical analysts utilize tools to help sift through the noise to find the highest possible trades. Every candlestick pattern includes four sets of data that define its shape based on that shape. Analysts can make assumptions about the behaviour of the price trend.
Every candlestick is based on the following:
- Open
- High
- Low
- Close
Hollow and filled candlestick – explained.
Keep in mind that the period or the “tick interval” used doesn’t matter. The hollow or filled bar that the candlestick pattern has created is called “the body”, while the lines that pop out from the body are known as “shadows”.
A stock that closes higher than its opening will have a hollow candlestick. On the other hand, if a stock closes lower, the body will have a filled candlestick. Remember that the most crucial candlestick formation is called “Doji”.
When is Doji created?
Doji is created once they open and close for a stock are virtually the same. Usually, Doji looks like a plus sign or a cross and is best described as a small or nonexistent body shape.
If you observe Doji from an auction theory perspective, you will realize that it represents indecision on the side of both sellers and buyers. Everyone is matched equally. Thus, the price goes nowhere, and sellers and buyers are in a standoff.
Keep in mind that some analysts interpret it as a reversal sign. Nonetheless, it is possible to be time once buyers and sellers gain momentum for the so-called “continuation” trend. Generally, Dojis are seen in periods of consolidation. They assist analysts in quickly identifying potential price breakouts. So, what about a Doji Star Candlestick pattern? Let’s explain it to you briefly.
What is a Doji Star candlestick pattern exactly?
 A Doji Star candlestick pattern represents a three-bar pattern that signals a possible upcoming reversal of the market’s current trend. Imagine it as a versatile candlestick pattern found in two variants, depending on the trend in which the candlestick exists.
These two different variants are:
- Star bullish
- Star bearish
Doji Star Bullish Candlestick Pattern Explained
The bullish Doji star appears in a downtrend, and it’s a part of the bullish doji star reversal pattern group. It is used in the technical analysis of stocks to determine when the trend will reverse after a long downtrend has been seen in the stock price. It is present in the downtrend and usually signs the reversal of one trend.
You are able to see it on the bottom of the candlestick chart in most cases, and it signals the beginning of the uptrend. The first candle of the Doji Bullish pattern could be either a standard red candle or a bearish, so-called “marubozu” candle, followed by a second small doji candle that represents indecisiveness in the market.
The third candle in this bullish pattern confirms the reversal of the trend. Keep in mind that the opening price of the second day is able to either be equal to the close of the first day or even lower than it. That’s considered a gap down opening.
How to trade this pattern?
To trade the bullish Doji star pattern the best, it’s advisable to initiate a trade on the long side whilst keeping a stop loss on the safe side if the price move is set to be in the opposite direction.
Also, it’s good to check 5 minutes and 15 minutes timeframes to analyze this pattern and take guards correspondingly.
The five bullish candlestick patterns with the best reversal signal
Here are the five bullish candlestick patterns that will provide you with the strongest reversal signal:
- The Inverted Hammer
- The Hammer
- The Bullish Engulfing
- The Piercing Line
- The Morning Star
- The Three White Soldiers
Morning Doji Star Candlestick
The morning star Doji candlestick formation represents a three-day bullish reversal pattern. It starts during a downtrend that continues with a candlestick that is large-bodied. The candlestick opens lower and trades in a small range on the second day.
Once it manages to do so, it closes at its open, forming a Doji. To sum it up, morning star patterns are known as favoured types of charts that predict the price action of a derivative, security or currency over a short period.
Evening Doji Star Candlestick explained.
An evening star Doji candlestick represents a long bullish candle that a Doji follows. It gaps up, and then a third bearish candle gaps down and closes well within the first candle’s body.
Doji Star Bearish Candlestick Pattern Explained
 Doji Star Bearish Candlestick Pattern could be seen in an uptrend. It is used in the technical analysis of stocks, determining the trend reversal stage. It happens once a long uptrend has been seen in stock price. Thus, typically, the bearish candlestick pattern signs the reversal of the trend.
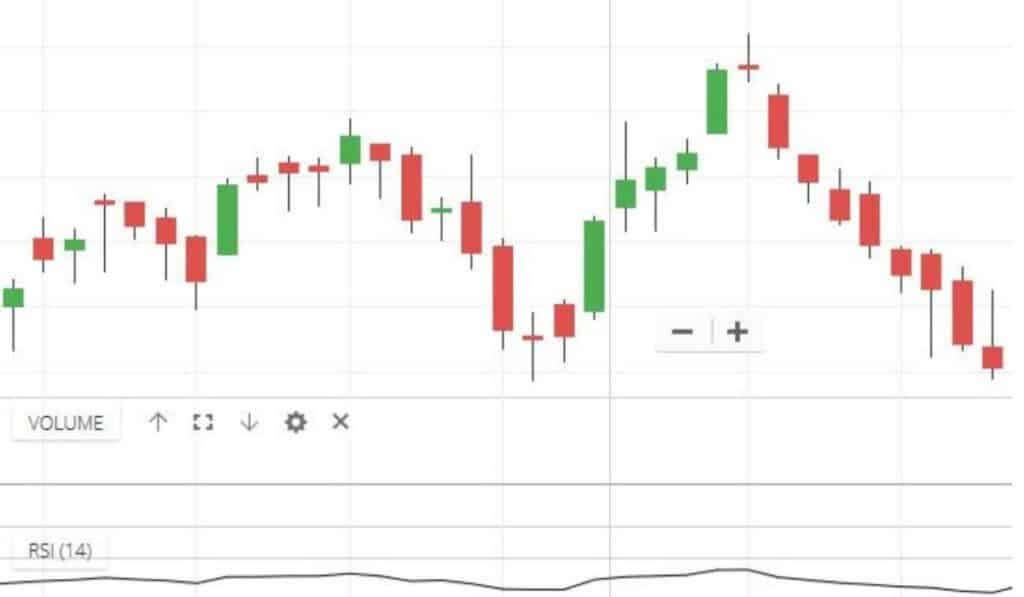
Here is one example of a bearish pattern. You are able to see a long green candle of the bullish trend at the top of the trend. It is followed by a Doji candlestick the following day. The opening price of the second-day candle represents a gap from the closing price of the first-day candle.
Afterwards, the third-day candle was coloured red, meaning that the closing price was lower than the opening price on the same day. It signals the uptrend reversal. As you can see, it is a typical Bearish Doji Star Pattern.
To trade a bearish Doji star pattern the best, it’s advisable to move to sell the stock whenever a bearish Doji star pattern shows.
Shooting star Doji candlestick pattern
A shooting star candlestick represents a pattern formed once the security price opens, then rises significantly and closes near the open price. It is a bearish reversal candlestick with a long upper shadow and no lower shadow.
Keep in mind that the distance between the highest price of the day and the opening price needs to be more than twice as large as the body of a shooting star candlestick pattern, occurring at the end of the uptrend and then signals the bearish reversal. So, it’s crucial to note that shooting star patterns typically occur at the top of uptrends.
How can you use the Doji Star Candlestick Pattern?
To properly use the Doji Star Candlestick pattern, don’t forget that it is a 3-bar reversal pattern that starts with a long candle, gaps to doji and reverses in the opposite direction. We have the first candle, either a marubozu candle or a standard red candle.
The first candle is followed by the second Doji candle, which is small and shows indecisiveness in the whole market. The opening price on the second day should either be lower than the first day or equal to the close.
Key Takeaways
- A Doji Star Candlestick Pattern is a versatile candlestick pattern.
- You can find two variants of the Doji Star Pattern: bullish and bearish.
- Bullish Doji star is seen in a downtrend, and it signs the reversal of a trend.
- The bearish Doji star represents a double candlestick formation observed by tech analysts as a bearish reversal pattern.
- A Doji candlestick is formed once, in a given time, a security’s open and close are virtually equal. For technical analysts, it generally signals a reversal pattern.
The post Doji Star Candlestick Pattern – How to Use it appeared first on FinanceBrokerage.

0 Response to "Doji Star Candlestick Pattern – How to Use it"
Post a Comment