Volume Spread Analysis – How to Analyze the Spreads?

Volume Spread Analysis – How to Analyze the Spreads?
Have you ever thought about using volume spread analysis for your trading needs? Are you aware of what this type of analysis entails? And why is an increasing number of traders using it on an almost daily basis?
Too many volume-related questions that require detailed answers. Stock traders worldwide are eager to learn all the possible details and analyses that can be of crucial help to them in achieving business goals. Since volume spread analysis is prevalent, it is no wonder why more enthusiastic individuals are looking for ways to analyze the spreads.
Thus we want to give you a basic explanation of what the term itself means in the first place, shall we?
What is volume spread analysis exactly?

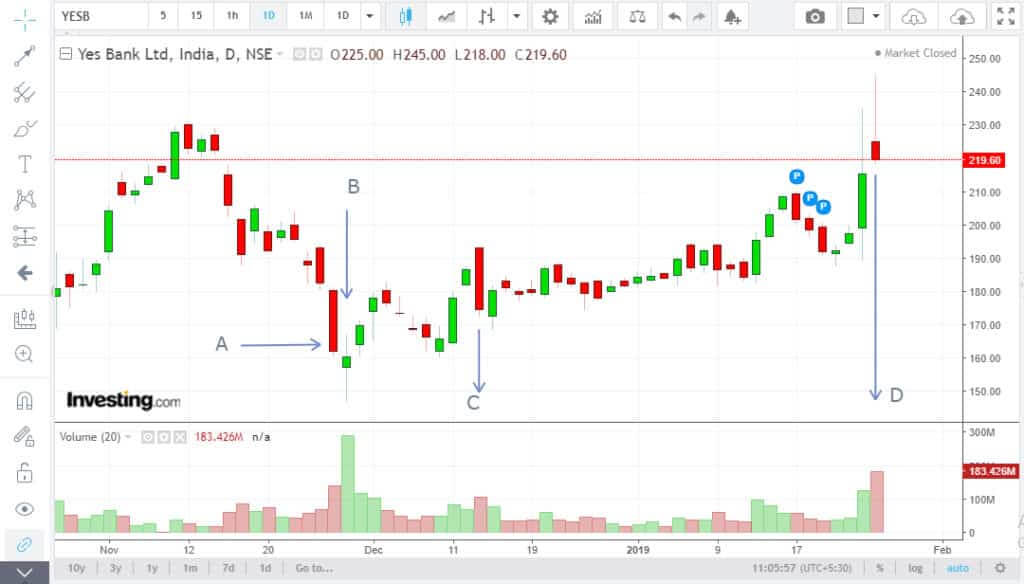
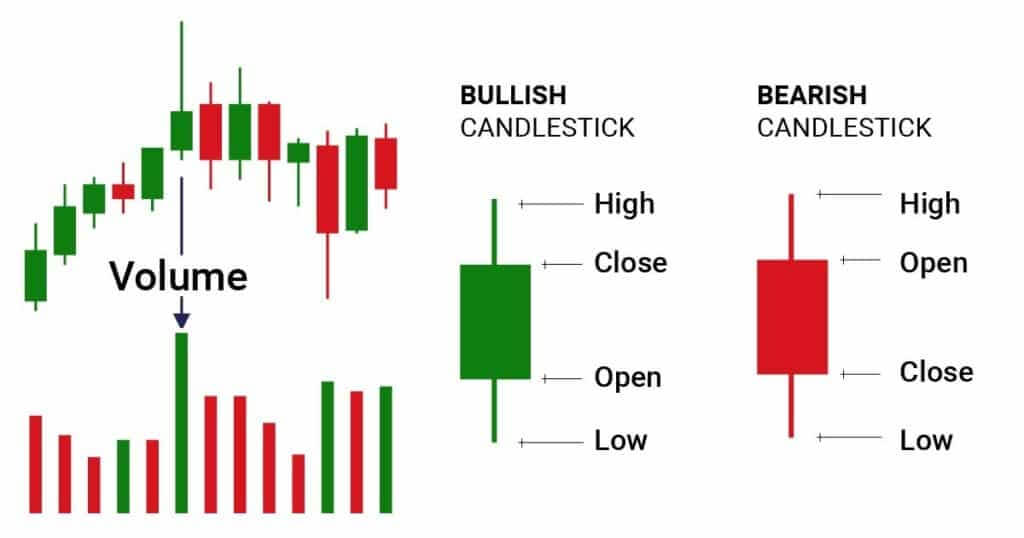
Volume spread analysis refers to a method of analysis that observes the candles and the volume per candle. The primary goal of this particular analysis is to decide the price direction. It looks at the three following things:
- The quantity of volume per candle
- Closing price
- Range spread
In other words, volume spread analysis, or the VSA, represents an entirely new way of observing the market in general. It is more like the candlestick analysis that’s considering the volume. It is one of the most crucial concepts of technical analysis.
Volume spread analysis indicator – briefly explained.
Volume spread analysis indicator processes data of thick volumes. The colour chart shows an assay value. Histogram indicator every bar represents the last or any other bar spread initially indicated in the information board on the right. It is usually white numbers.
In short, this indicator represents the judging level of volume per single bar according to the rules of the VSA.
Who clarified the concept of volume spread analysis?

The concept of Forex volume spread analysis has been clarified by Dr Alexander Elder, one of the most successful developers of technical tools. Besides that, he was an author of numerous top-selling financial books, making him highly influential in the financial world.
The consensus in Elder’s books is that the volume plays a significant role for traders. Thus, it’s one of the key movers in the market. Another reason why it’s considered significant is that the market is usually moved by greed and fear among all participants. At the same time, the volume plays a significant role in confirming chart patterns and trends.
To truly understand the volume spread analysis the best, it’s essential to take a step back and back and understand what the terms “volume” and “spread” actually mean. So, let’s start with the volume, shall we?
Understanding the volume
Volume represents a particular amount of an asset traded in a given period. Here is one example that will help you understand volume the best:
Suppose that 10,000 shares of Apple are purchased and sold within a day. It’s known as the “volume”. If the volume drops to 8000 the next day, we can say that the volume has declined.
What is a spread?
On the other hand, a spread means a difference between two things. In Forex trading, a standard definition of a spread is the difference between a particular pair’s bid and ask price. Here is also a helpful example:
If the USD/GBP has a bid of 0.91420 and an ask of 0.92426, the spread is about 20. Remember that there are numerous different examples of spreads. For instance, if the price of Brent is trading at 85 dollars and WTI at 80 dollars, the spread will be 5 dollars.
Thus, as mentioned above, the volume spread analysis is a method of analysis that looks at candles and the volume per single candle to determine the price direction.
How can you spot a volume spread analysis the best?

If you were wondering how you can spot VSA, it’s essential to make sure you’re using candlesticks for trading. It doesn’t work well if you use other chart types such as Renko charts, lines, and bars.
Once you’re done so, it’s time to ensure that your chosen broker offers reliable volume. Finally, it’s essential that you pay attention to the chart’s timeframe since, in most cases, volume analysis on short timeframes will not make much sense.
According to our expert opinion, traders need to use daily, weekly or monthly charts. In addition to that, it’s recommended for you to observe the spread between the volume bars and price bars to spot the trend.
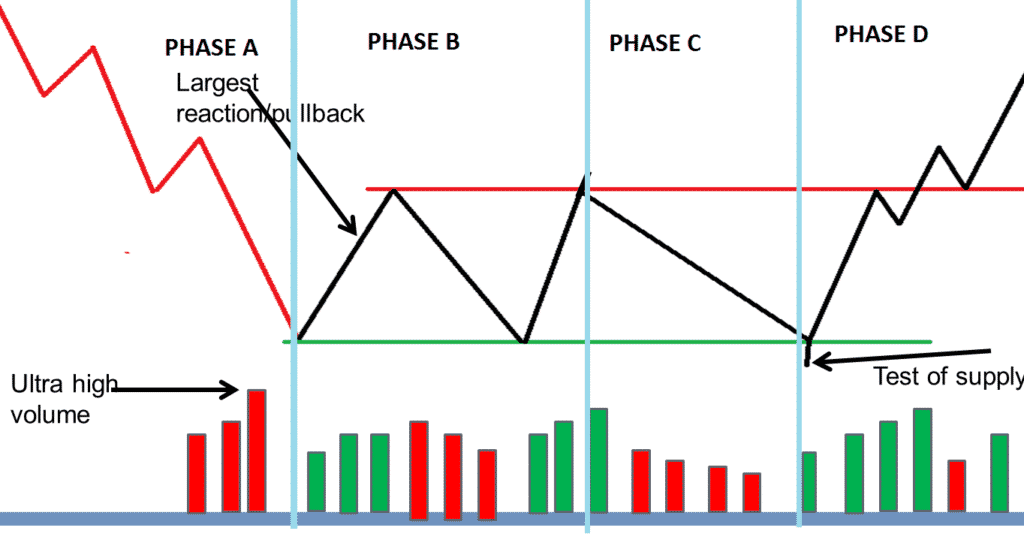
Accumulation
Accumulation represents the first step in understanding what happens to be the “volume price analysis”. For instance, if you’re an entrepreneur who sells shaving blades, the more you sell, you’ll need to market your products and showcase their advantages against the price.
It is crucial to be 100% assured that you have enough products to sell because, on the contrary, the campaign won’t achieve its goal. This is called “Place” in the marketing mix. At the same time, in the Forex volume spread analysis (VSA), it is known as accumulation, where insiders fill up their warehouses, increasing the ownership of the assets.
So, as all insiders purchase products, the asset’s price will continue to fall. The media has a lot of impact in this phase.
Distribution
Once the goal of reducing the price and increasing holdings is achieved, the next step is the distribution. At this stage, insiders are already familiar with their assets. Thus they commence moving the market up.
Again, in this stage, the media also plays a crucial role in exciting these assets that insiders own. So, as a result, the price of the assets, which had significantly declined, started to rise suddenly. That rise starts fast even before becoming gradual.
Testing supply
The third phase in volume spread analysis that everyone should pay special attention to is testing supply. It’s necessary to test the market before coming back to the first accumulation stage is essential since insiders do not want to continue buying and be met with a new wave of selling from retail investors.
And they certainly don’t want that. In the testing supply phase, they will start a minor selling campaign where they will be selling low volumes of the assets intending to create demand and, thus, higher prices.
Testing demand
If all goes well and as planned with the supplied test, the next step is to test the demand. In this phase, insiders don’t want to start a campaign to fill their warehouses and get back to an area that includes high demand, thus pushing the market in the opposite direction. To avoid this unwanted scenario, insiders will deploy a test.
Testing demand is crucial to ensure the demand pressure has successfully been absorbed in the distribution phase. In addition, insiders have already managed to move the price from the wholesale price to their desired retail level.
Once this testing demand is completed, they will start a new wave of selling, pushing the price much lower.
The selling climax
The selling climax is the fifth phase that one trader should know while analyzing a volume spread. So, in the first stage, retail investors are selling while the insiders are buying simultaneously. It means that insiders are these crucial investors and hedge funds who know a lot about the company and work for hand in hand with investment bankers.
In this phase, the insiders commence a selling campaign that uses media as their mouthpiece and are pushing the price down to start the first phase once again.
What tool should you use for the VSA?

To do a proper volume spread analysis, we highly recommend a convenient tool called “the Volume Spread Scalper”. It displays real-volume spread analysis indicators for a proven trading edge in each futures market.
This tool includes pinpointing entry signals that enable you to make up to 200 traders per single day. Thus, it is a powerful tool to use if you are a serious and devoted trader!
Does VSA function in all markets?
Nearly all financial markets such as futures, stocks, and forex seem to fit the bill. Volume Spread Analysis focuses on the volume and price to find the actions of professional traders.
For that reason, as long as the market includes a group of professional traders and enables reliable volume and price data, the trading premise of VSA seems to hold.
Nonetheless, keep in mind that volume may be a tricky concept in the Spot Forex market since you won’t get actual traded volume. Instead, you’ll get tick volume that measures the times the price ticks down or up.
If you wish to use VSA methods for trading spot forex, you must determine if your source of thick volume equals proxy for actual volume.
Summary
Volume Spread Analysis, or VSA, represents a methodology that takes a multi-dimensional approach to how traders analyze the market in general. It looks at the relationship between volume, range, spread, and price. Understanding their actions is significant since it may give you great signals to enter the market.
Knowing how to read and understand the relationship between volume and price will help you accurately predict the market direction. It pays attention to volume, range/spread, and closing price relative to the range.
The post Volume Spread Analysis – How to Analyze the Spreads? appeared first on FinanceBrokerage.
0 Response to "Volume Spread Analysis – How to Analyze the Spreads?"
Post a Comment