What is There to Know About Candle Pattern?

What is There to Know About Candle Pattern?
In terms of trading, it is essential to be able to predict and anticipate trend reversals and spot reversal candle patterns. Technical traders know it well: it is useless to go against the trend. Predicting trend reversals is possible with the help of technical analysis. Many indicators make it possible to place, confirm and validate trend reversals. In trending markets, trend indicators are used to enter a trend and determine the support and resistance levels of a security, then to set targets.
What is the reversal candle pattern?
A reversal candle occurs when the price first trades above the high or below the low and then reverses. These candles are especially important when they appear after a very clear bullish reversal candle or bearish trend. This type of candle often forms when traders close positions intended to follow the trend. The reversal candle does not specifically indicate that the trend will reverse but that prices are adjusting following a large movement. And in the best case, it is the entire movement that is adjusted.
The markets in which reversal candle pattern is most frequent
Obviously, reversal candles are present in almost all markets, but there are markets where the probability of seeing this type of candle is greater. The oil market is an example, especially American oil with the WTI futures contract. ‘spikes’, or reversal candles, are very common in this market. This phenomenon can also be seen on the DAX. But it is in the forex market that the event is most frequent.
If your trading strategy is trend following, you need to take a position well before the reversal. If your trading plan is to optimize your trade entry, then you need to detect this trend change.
But it is difficult without knowing the right information and tips. Fortunately, we are here to help you.
After reading this article, you will know:
- How to find a trend and define if it is at the beginning or at the end.
- The tools allow you to define a possible trend reversal.
- The chart figures and the Japanese candlesticks indicating that the trend is running out of steam.
So let’s start without further delay, and you will have better weapons to make capital gains.
Know how to identify a stock market trend to anticipate a reversal
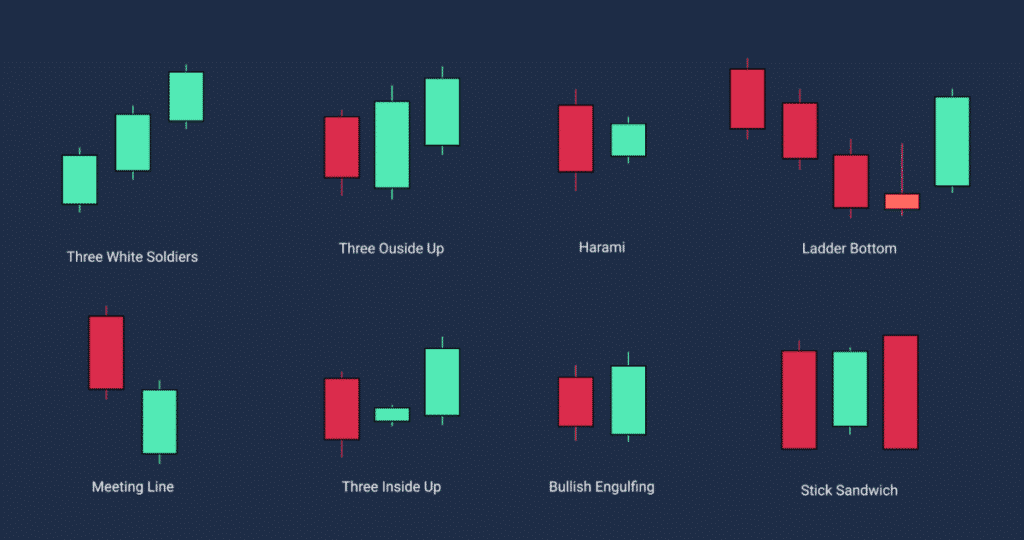
Above all, spotting trends is essential to be on the right track. It is often said that: “trend is your friend “. Unless a stroke of luck, you will take a position at the start of a bullish or bearish movement. And never you will take your profits at the end of this trend.
Is it an up or downtrend? The question seems simple so let’s clarify these remarks a little. What is the long-term trend of the financial asset you are studying? What is the short term trend?
For example, you are doing technical analysis on the Dow Jones, and you see that its movement is bearish. But in what unit of time do you do your graphical analysis of the Dow? In fact, to properly identify the trend of the asset, start with the longest time unit.
It also depends on your type of trading. If you do swing trading or day trading, your investment strategy will be different. Over the long term, the Dow Jones has been rising for years. However, it sometimes corrects quite violently because the index is quite volatile. So in the shorter term, you can bet on the decline of the asset.
Reversal candle – What causes the market’s trend reversal?
We often observe stock market trends that change suddenly without knowing why because we lack knowledge or information. Two major factors stop an uptrend or a downtrend in a stock market.
First, there is the technical analysis that you have done which allows you to identify supports and resistances. These price levels have more or less importance depending on the time units. When you arrive at monthly or weekly support, there is a good chance of having a support bounce. Your downtrend will therefore be stopped, and a reversal of the trend may occur.
The other factor that can cause the trend to change is macroeconomic releases. A FED conference on key rates can cause a violent reversal in a stock market index or a currency. That’s why one should always keep an eye on the macroeconomic calendar.
Reversal Candle – Trend changing powerful tools
Now that you know how to properly find the trends of an asset, we will go over the indicators and other tools allowing you to detect a trend reversal. Some stock market tools allow you to confirm a trend reversal, while others announce a possible reversal.
Mixing all these technical indicators and these reversal patterns will allow you to optimize your entry into the markets. In addition, mastering these tools and chartism will allow you to work on all assets such as global stock market indices, forex, commodities, the stock market or even cryptocurrencies.
Reversal candle – Technical indicators for forecasting trend reversal
Depending on the technical indicators, you will either have a confirmation of a reversal or an index that prepares for a change in the trend.
A crossing of moving averages will confirm a trend reversal in the more or less long term. The crossing of the MM20 and the MM50 is a real trend change signal. If you have other indicators that confirm it then it may be wise to enter a position against the trend.
On an RSI or MACD indicator, you can also identify bullish divergences or bearish divergences. In this case, you can check if you are in a support zone or in a resistant zone. You will just have to look for a signal to take a position against the trend.
Finally, on the volume indicator, it suffices to observe a drop in the histogram to have an indication of a trend reversal. This is especially valid for buying a stock that has fallen sharply.
Find our complete topic on stock market indicators.
Trend reversal candlestick patterns
Chartism is a part of technical analysis that should not be overlooked. You have typical figures that announce that the market trend may reverse.
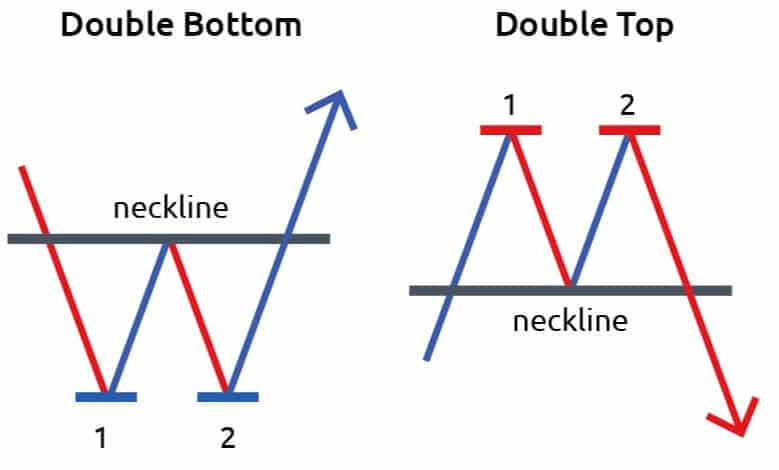
#The double top and the double bottom or double action reversible candle:
This figure is simply materialized by two successive reactions of an asset under resistance or a support. More commonly, it is also called the W.
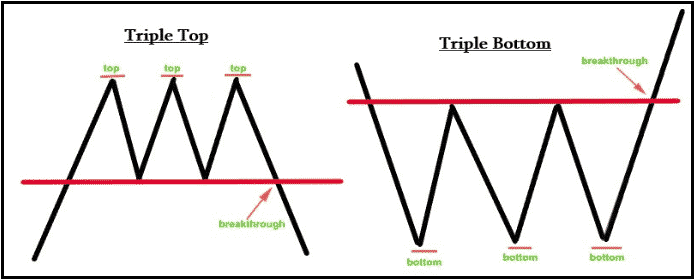
#The triple top or the triple bottom:
This figure works on the same principle as the double top or the double bottom. With the difference that you have a neckline that will have to be broken to confirm the trend reversal.
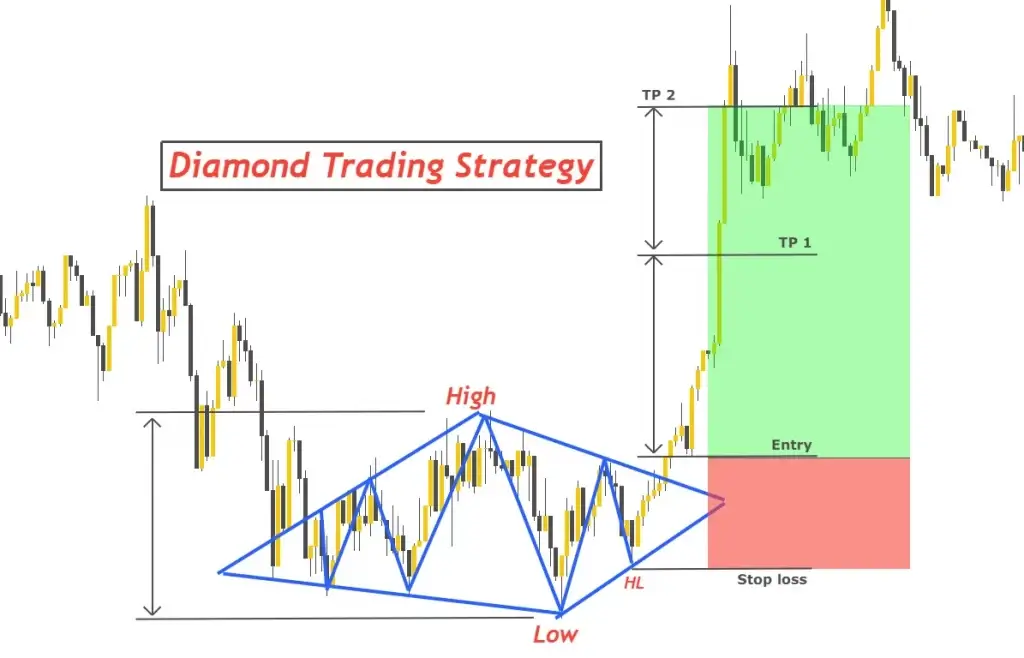
#The Diamond:
When you reach an area of support or resistance, the diamond is actually a diamond formed on the asset’s chart. The diamond is confirmed when your oblique trendline is broken when you draw your trendlines
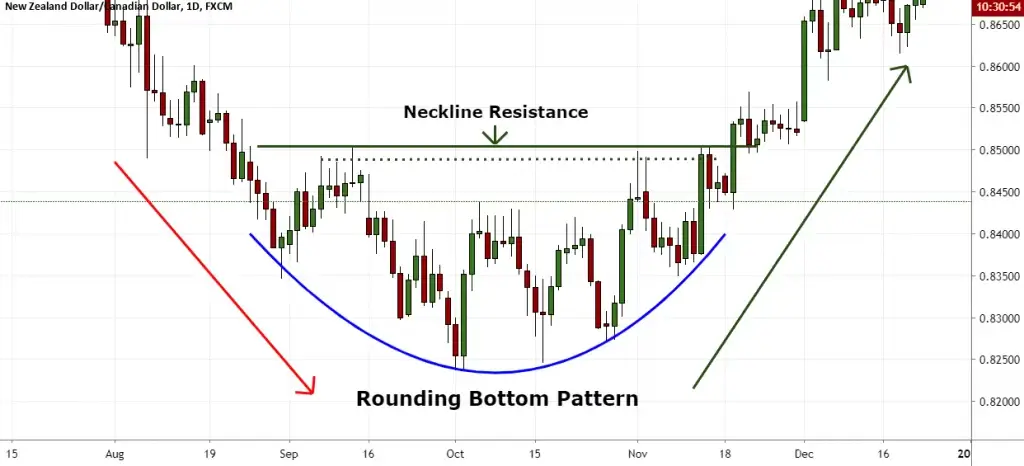
#The rounding bottom:
This figure is represented by a rounded shape where the court tightens in a range at its end. Then the asset goes up again with the swallowing of a candle to confirm the change in trend.It’s a long-term reversal pattern. And it’s best suited for weekly charts
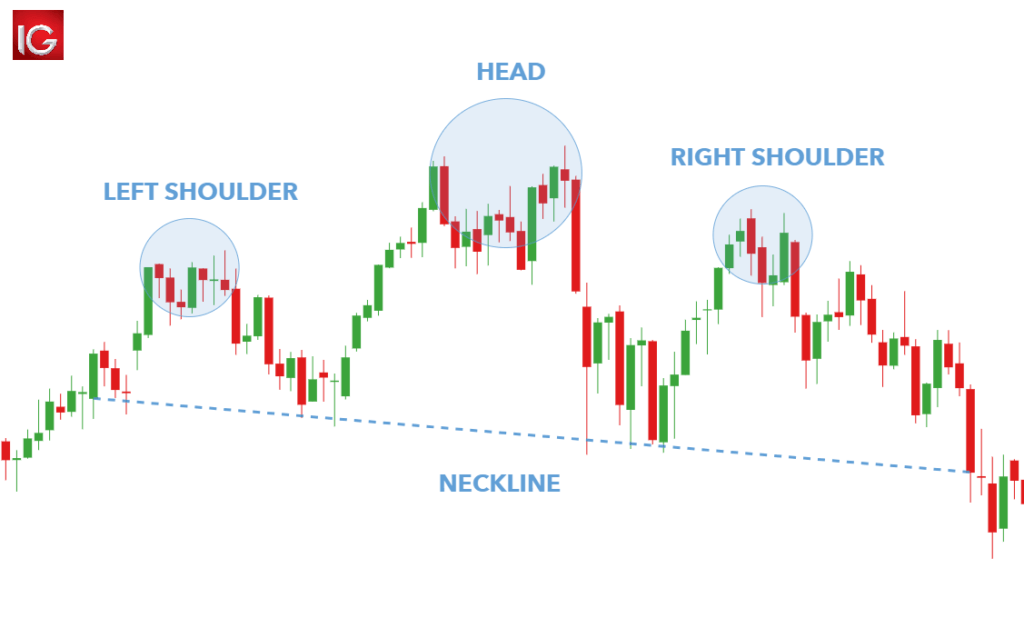
#The head and shoulder:
can also be reversed if the court reaches support. It takes the form of a human silhouette with 3 peaks where the one in the centre is higher than the other two on each side. The breakout of the neckline confirms the trend change.
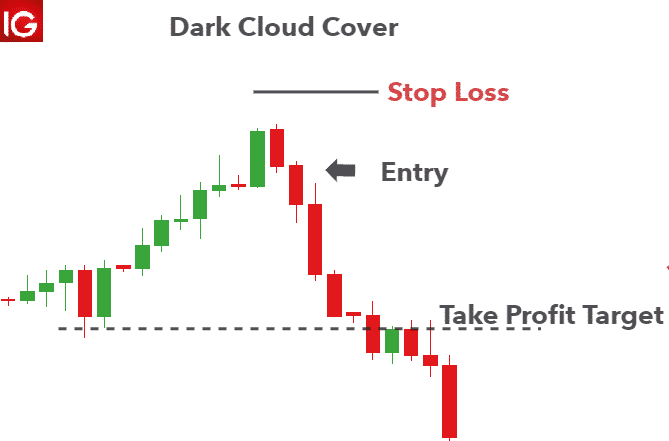
#Bullish engulfing / Dark Cloud Cover:
The first candle reflects the direction of the current trend. The second candle should be the opposite color to the first. In the case of a bullish engulfing, the open must be below the low of the previous candle. (bearish gap at the open). The close should be in the upper half of the body of the previous candle.
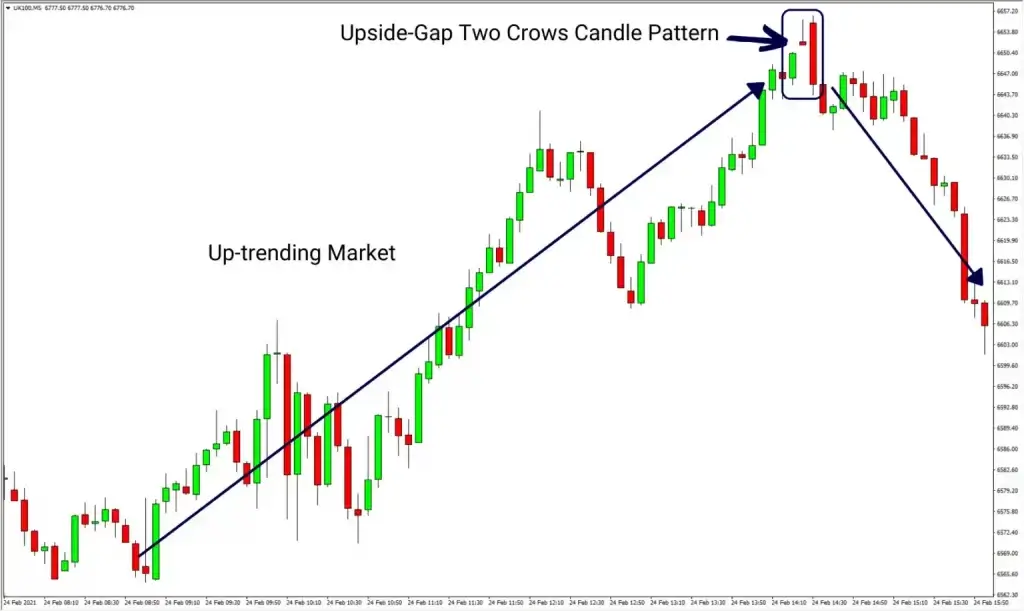
#Upside gap two crows:
This figure only appears during an uptrend. It is characterized by a small red candle that forms a gap with the previous long green candle. A second red candle forms a bearish engulfing with the previous one but closes above the closing price of the green candle.
You also have the Morning Star, the Evening Star or the Abandoned Baby (and yes, it does exist). In short, do not neglect the study of Japanese candlesticks for reversal patterns and mainly the reversal candles that give strong buy or sell signals.
Validate a trend reversal, and you will optimize your market entry point.
Now you have all the knowledge to properly identify reversal candle patterns and trend reversal. Thanks to this, you will take fewer risks, and above all, this control allows you to deal with sudden movements in a market. You will be able to place your trade more precisely, and your profits will be greater.
Ultimately, it doesn’t matter what your trading style is. If you are a scalper, day trader or swing trader, detecting a reversal in trend is essential. There is a simple rule: in a trend, you never buy resistance and never sell support. You need confirmation by a break of resistance or support and, above all, that there are no divergences on the technical indicators.
The post What is There to Know About Candle Pattern? appeared first on FinanceBrokerage.

0 Response to "What is There to Know About Candle Pattern?"
Post a Comment