12 August chart overview for Gold and Silver

12 August chart overview for Gold and Silver
Gold chart analysis
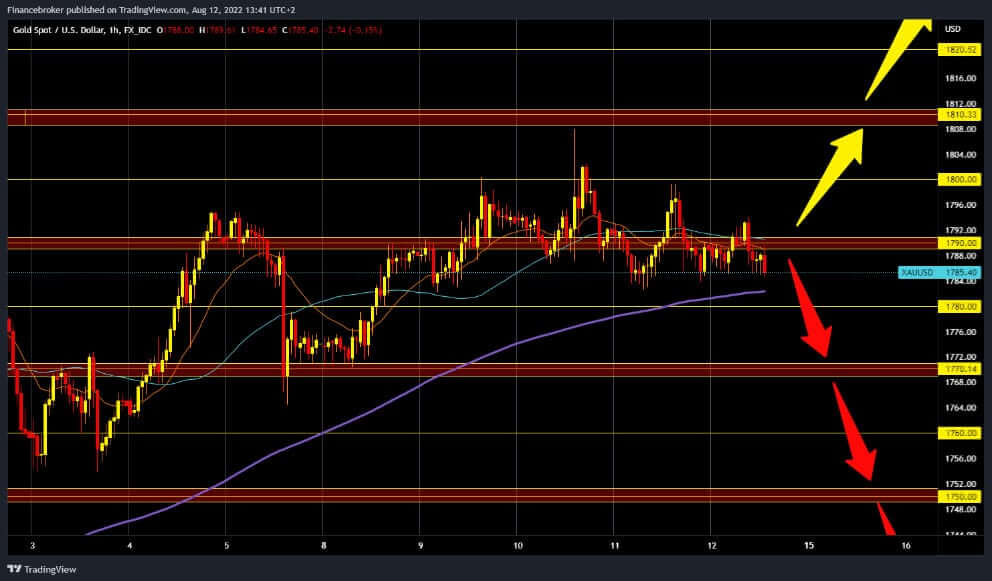
Gold slowed down its bullish trend forming a lower high at $1798 yesterday. Then there was a new price pullback to $1784, where we now have some support. Today, the price of gold forms a new lower high at $1794, which could signify a transition to a bearish trend if we see a drop below the $1780 level. For something like that, we need a more concrete negative consolidation. Potential lower targets are $1770, $1760 and $1750 levels. We need a positive consolidation and a return above the $1800 level for a bullish option. Then we need to hold above to consolidate for the next bullish impulse. Potential higher targets are $1810 and $1820.
 Silver chart analysis
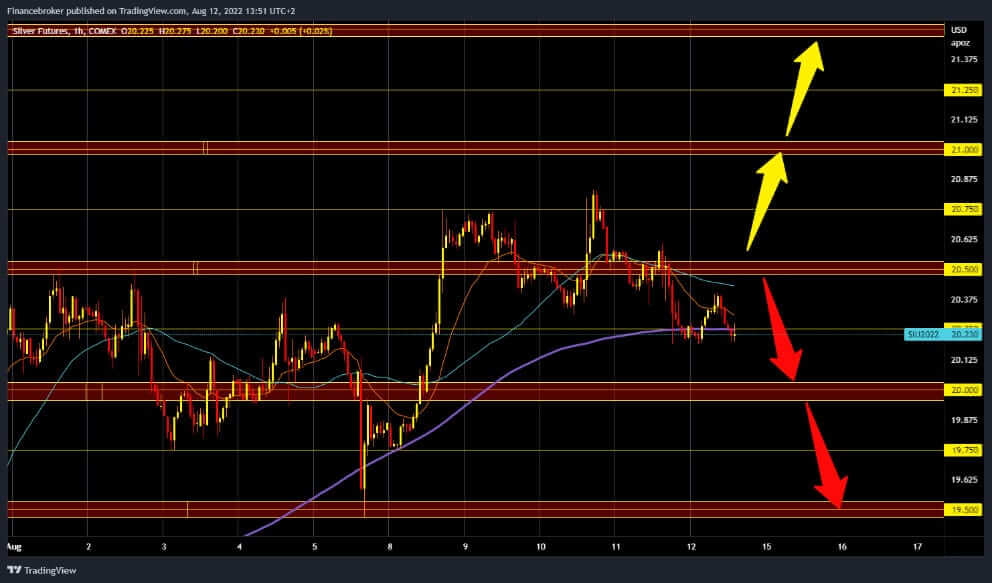
The price of silver yesterday failed to reach the $21.00 level. On the contrary, the price formed a new lower high at $20.60. After that, the price pulled back and closed the day at $20.25. During the Asian trading session, the price tried to climb up to $20.50, but without success, because a new pullback followed down to today’s initial position. We need a continuation of the negative consolidation and a further pullback to the $20.00 support zone for a bearish option. Potential lower targets are $19.75 and $19.50 levels. We need a return above the $20.50 level for a bullish option. After that, we need to hold above and start a continuation towards the $20.75 resistance zone. Potential higher targets are $21.00, $21.25 levels.
 Market overview
The peak of inflation in the USA indicates the risk of a potential fall in the price of gold. Increasing recessionary pressure and geopolitical risks could form a bottom for the price of gold and send it to the bullish side. In 1980, when inflation peaked at 14.7%, and in 2011, when inflation reached 3.9% in September, the price of gold retreated. Rising geopolitical tensions, a potential new Corona pandemic, and economic risks could provide some support to the gold metal.
The post 12 August chart overview for Gold and Silver appeared first on FinanceBrokerage.
0 Response to "12 August chart overview for Gold and Silver"
Post a Comment